Expertise in urban heat island (UHI) studies
At EOLIOS, we bring together our cross-disciplinary skills — CFD, entropic heat, air conditioning, field metrology and microclimate analysis — to understand, anticipate and limit the effects of urban heat islands (UHI).
Model
- High-resolution urban CFD modelling
- Support for bioclimatic design
- Visualisation of the gains from the solutions
Anticipate
- Simulation of climate-adaptation scenarios
- Support for discussions with local residents
- Decision support for planning documents
Design
- Effects of the layout (ground, materials, vegetation)
- Airflow phenomena and site effects
- Design of bespoke solutions
A local effect with global consequences
Urban heat islands result from a combination of factors linked to the way cities are built: high building density that limits natural ventilation, a large mineral footprint (asphalt, concrete) that stores heat, a lack of vegetation or cooling surfaces. Roads, low-albedo materials with high thermal inertia, and building orientation trap heat — especially at night, when temperatures stay abnormally high compared with neighbouring rural areas.
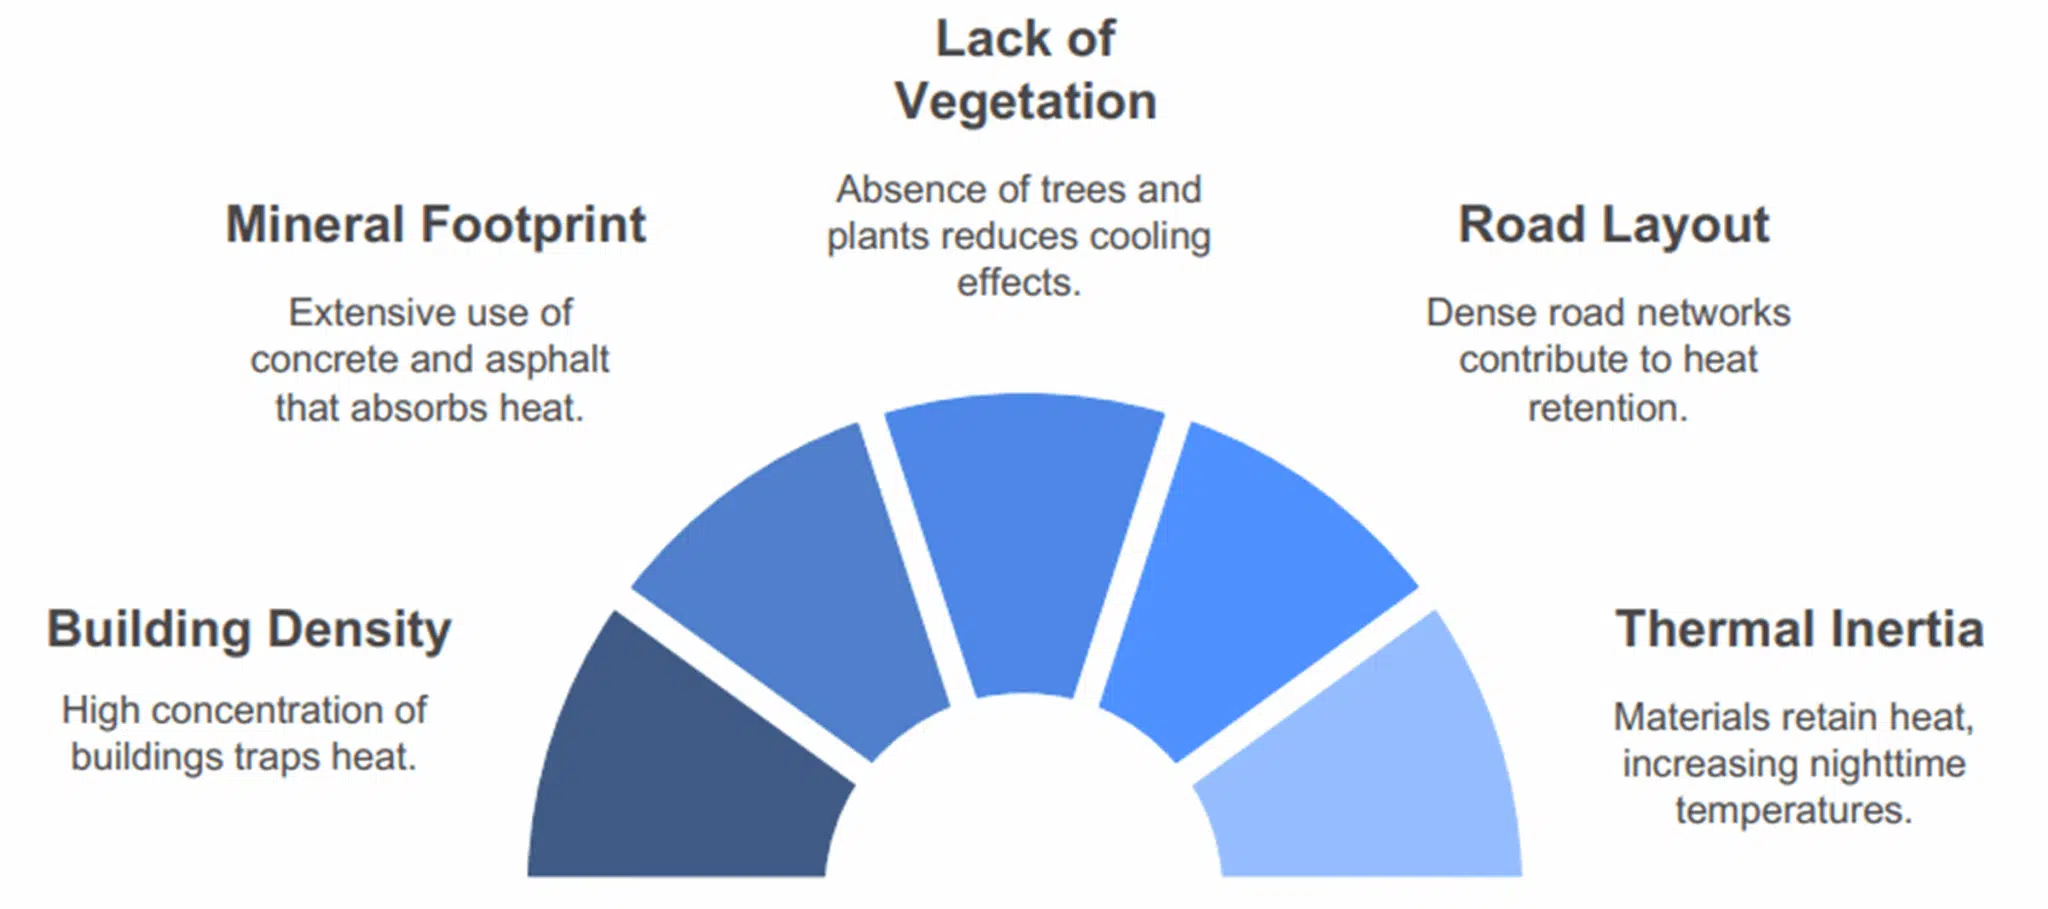
This phenomenon is not limited to a rise in temperature. It increases summer thermal discomfort and endangers the health of vulnerable populations. It intensifies episodes of air pollution by encouraging the stagnation of warm, pollutant-laden air masses. In energy terms, it increases buildings' cooling needs — hence a rise in electricity consumption and, paradoxically, an indirect contribution to global warming. The heat island thus embodies a local issue with global repercussions, making it essential to address from the urban design stage for more sustainable and resilient territories.
Identifying the sensitive areas and the mechanisms at play
The urban heat island does not appear uniformly: each district, each street develops its own thermal signature, depending on its architecture, its uses, its vegetation density or its ability to exchange energy with the atmosphere. It is in this heterogeneity that the keys to an effective adaptation strategy lie.
EOLIOS deploys rigorous diagnostic methods: campaigns of in-situ measurements — surface temperatures, relative humidity, radiation flux, air speeds at pedestrian level — combined with an analysis of land use, materials and urban geometries, to map the at-risk spaces: mineralised courtyards, dark absorbing façades, stagnant air pockets, over-exposed retail frontages. Beyond the observation, our added value is to explain the physical mechanisms at work: excessive inertia of the surfaces, lack of night-time cooling, unfavourable orientation of the air-circulation axes.
Mapping and measuring UHIs
From field surveys to vulnerability maps
Mapping heat islands requires a fine knowledge of the terrain and rigorous use of data. It combines in-situ measurements and meteorological data records to visualise the thermal dynamics at district scale. We deploy temporary sensors to record surface and air temperatures, relative humidity and wind speed, at different times of day and during heat episodes, in order to capture the most significant contrasts:
- ↳
Data from third-party sources for land use and urban forms;
- ↳
On-site surveys (material types, soil permeability, shading);
- ↳
Local climate information (wind exposure, sunlight);
- ↳
Digital models of the terrain to identify enclosed zones.
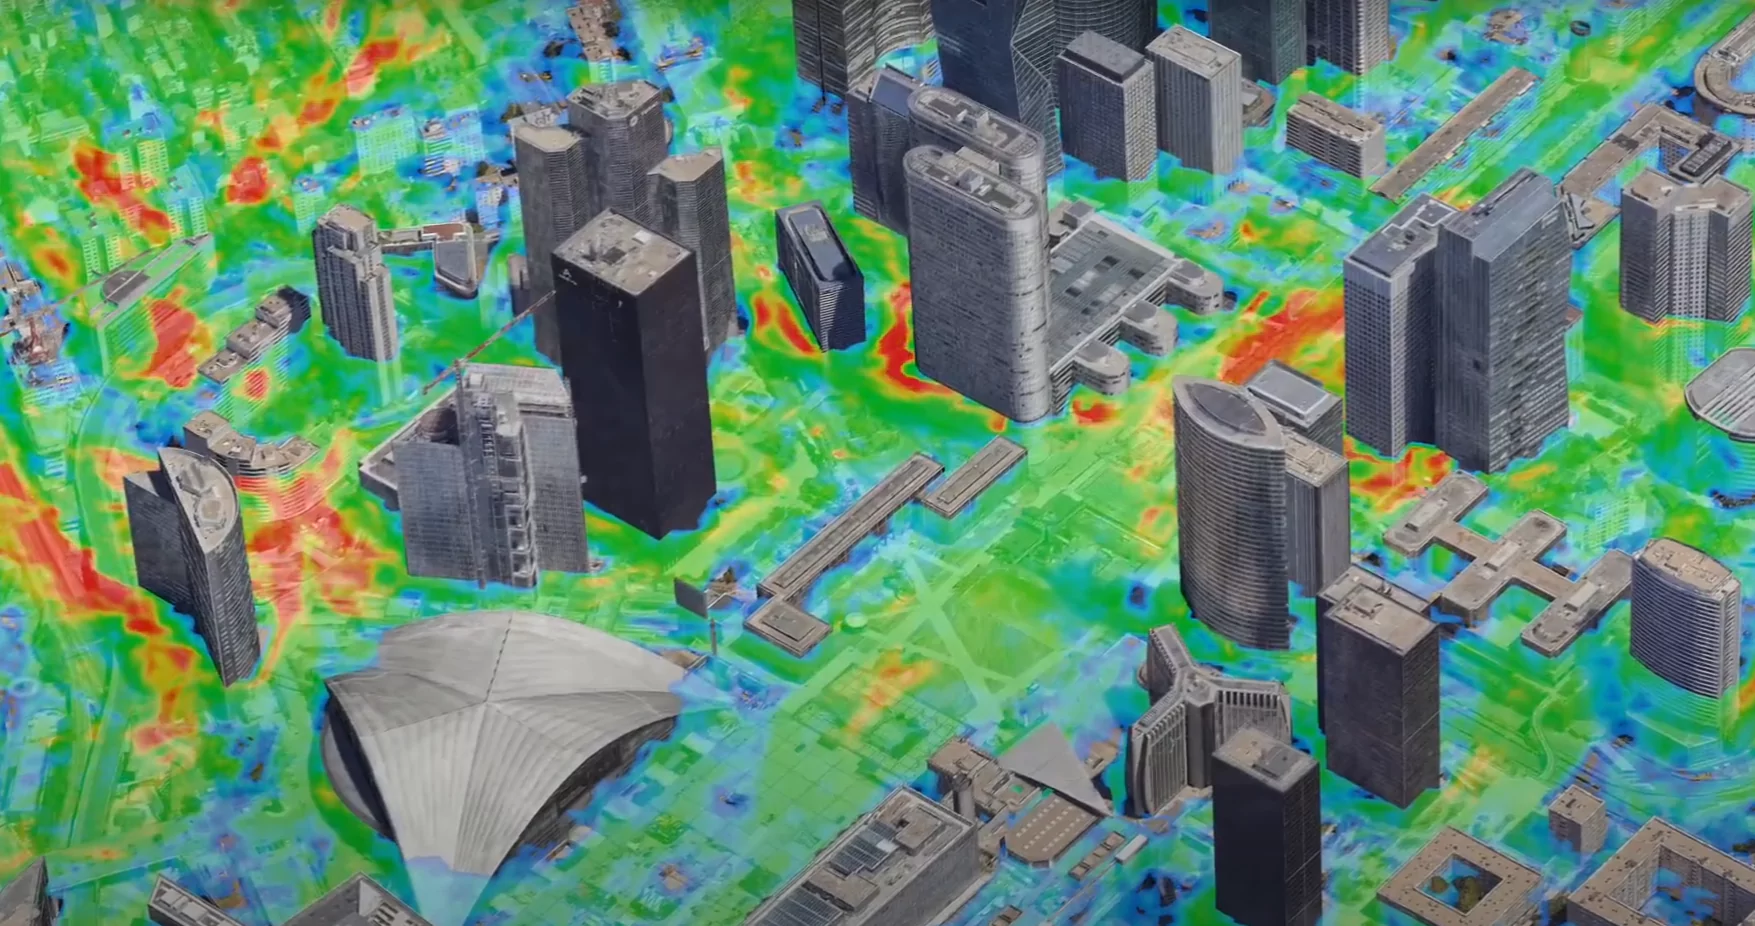
This cross-referencing of data makes it possible to produce highly readable temperature maps, showing intra-urban thermal differences and locating the heat pockets, the cool corridors or the zones with strong improvement potential. Developers and local authorities thus have a solid basis to objectivise the intervention priorities and integrate UHIs into climate urban-planning policies.
Visualise the differences and understand the causes
The heat island is rooted in the very morphology of the city. Through spatial analysis, EOLIOS highlights the links between urban configuration and temperature rise: narrow streets, absence of vegetation, heat-storing materials, dense built fabric — all identifiable and mappable factors. By combining thermal surveys and urban indicators, we objectivise the most exposed zones and target the real drivers of overheating, to help decision-makers prioritise the intervention priorities.
Simulate the microclimate impact d'un projet
Integrating the microclimate from the design phase
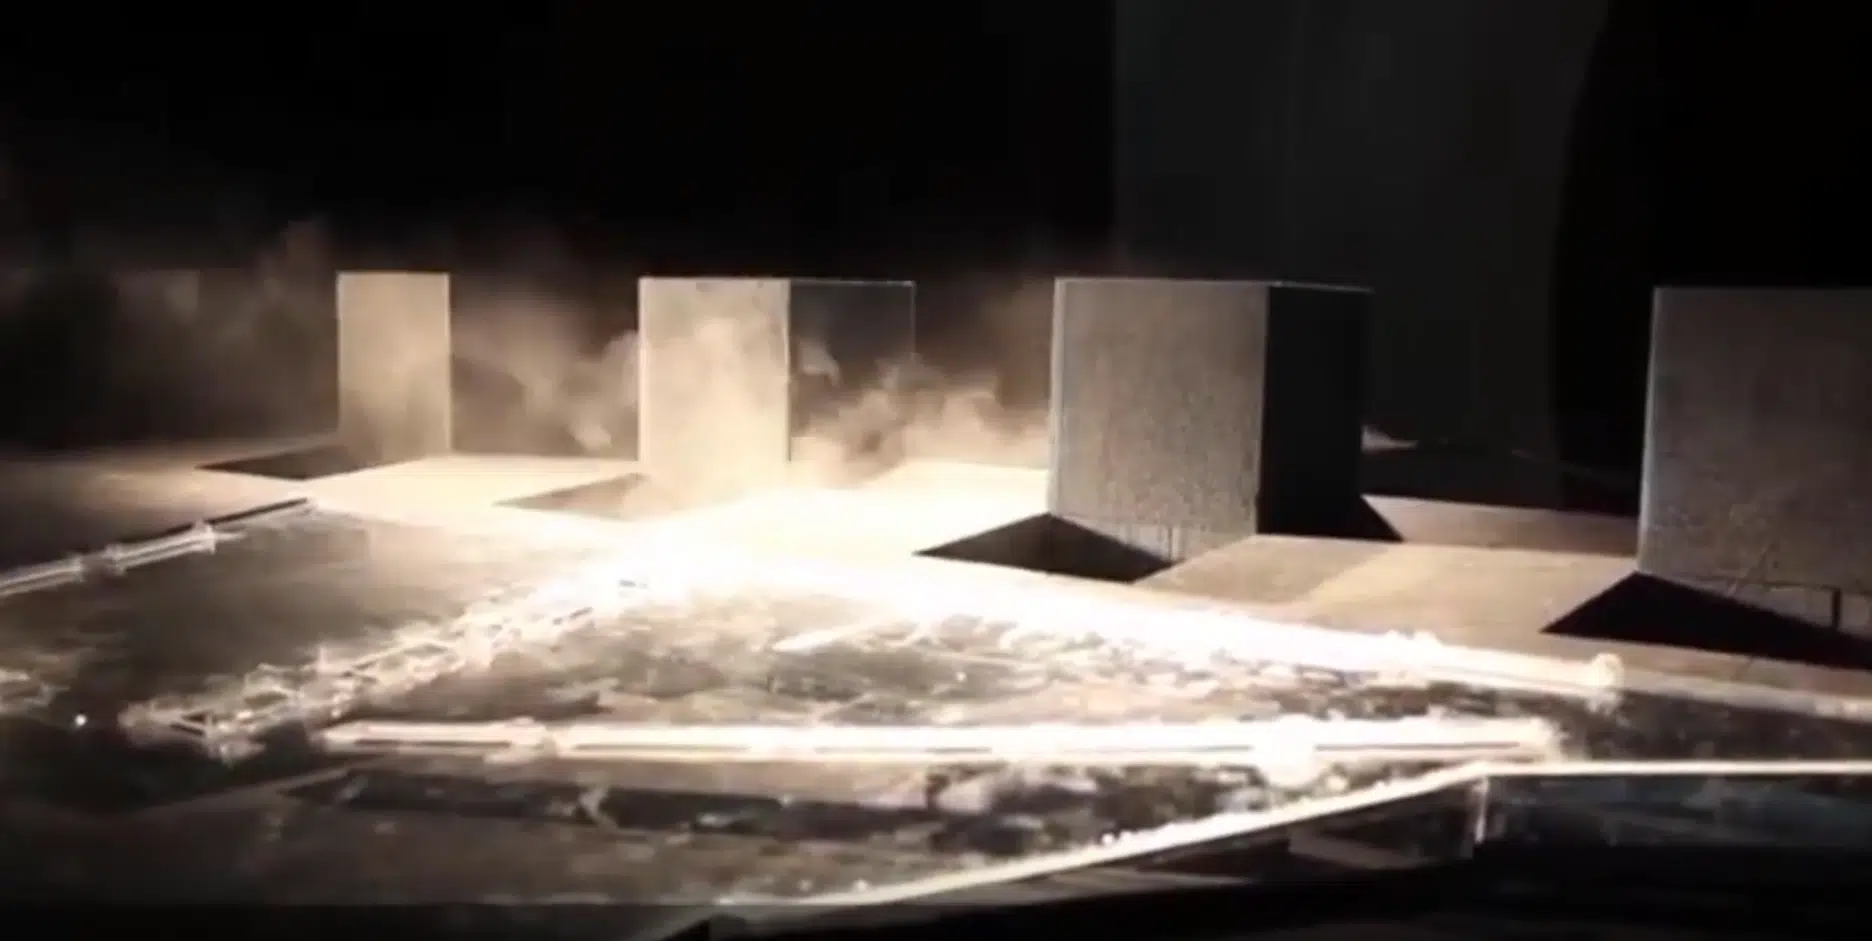
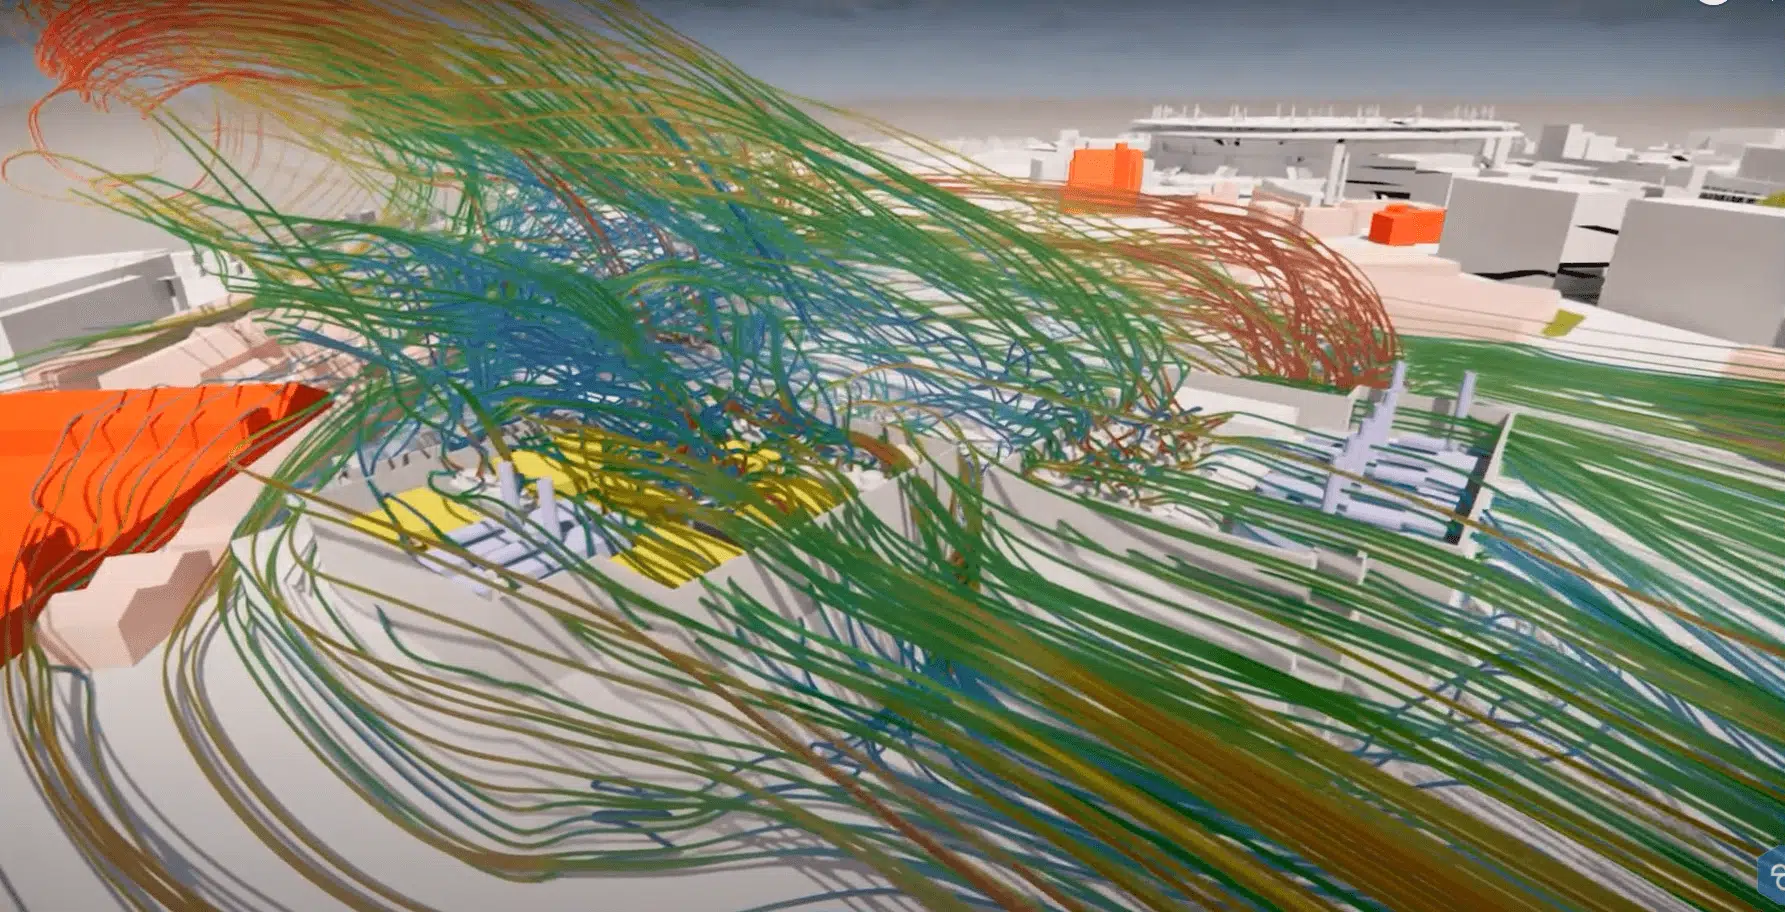
Architectural and landscape choices directly influence the local climate of a district. From the earliest phases, EOLIOS incorporates a fine analysis of the microclimate impacts through CFD simulations (airflow, temperature, radiation) and multi-scale thermal modelling, to anticipate the effects of a building or development on its surroundings: distribution of shaded zones, creation of warm-air pockets, day/night temperature changes, interaction with the surrounding air masses.
This preventive approach guides the choices of siting, morphology, materials or ground type, to limit the worsening of heat islands and strengthen the climate resilience of the projects — particularly in dense areas or urban renewal. By integrating these parameters early on, EOLIOS makes the microclimate a criterion of lasting quality.
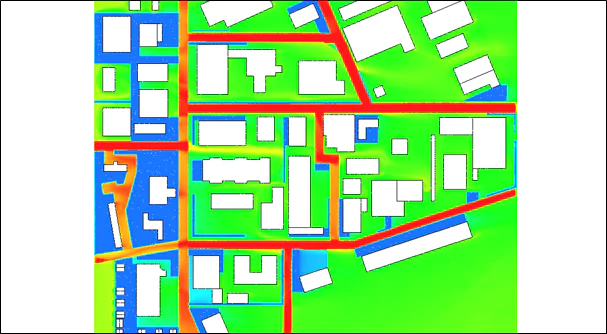
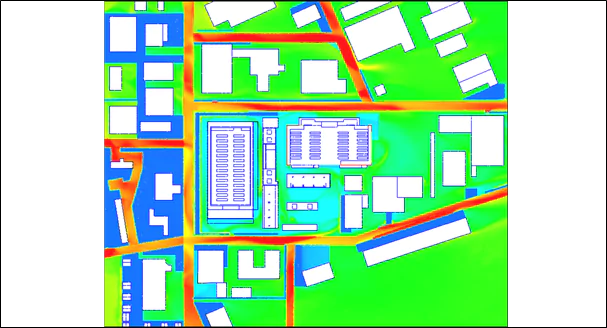
Learn more: study of the heat-island impact formed by data centers
Optimising the urban form to limit overheating
The configuration of the urban fabric influences how heat accumulates and dissipates. We analyse the impact of the urban form on airflow, radiative exchanges and passive cooling, through numerical simulations. By comparing several site-plan or layout variants, we identify the most effective arrangements to:
- ✓
Promote air circulation and night-time renewal;
- ✓
Maximise the shaded zones cast during the day;
- ✓
Avoid thermal accumulation effects in narrow or enclosed streets;
- ✓
Preserve the vegetation continuities and permeable soils;
- ✓
Limit the thermal mass effect in the densest areas.
Designing adaptation strategies
Testing nature-based solutions
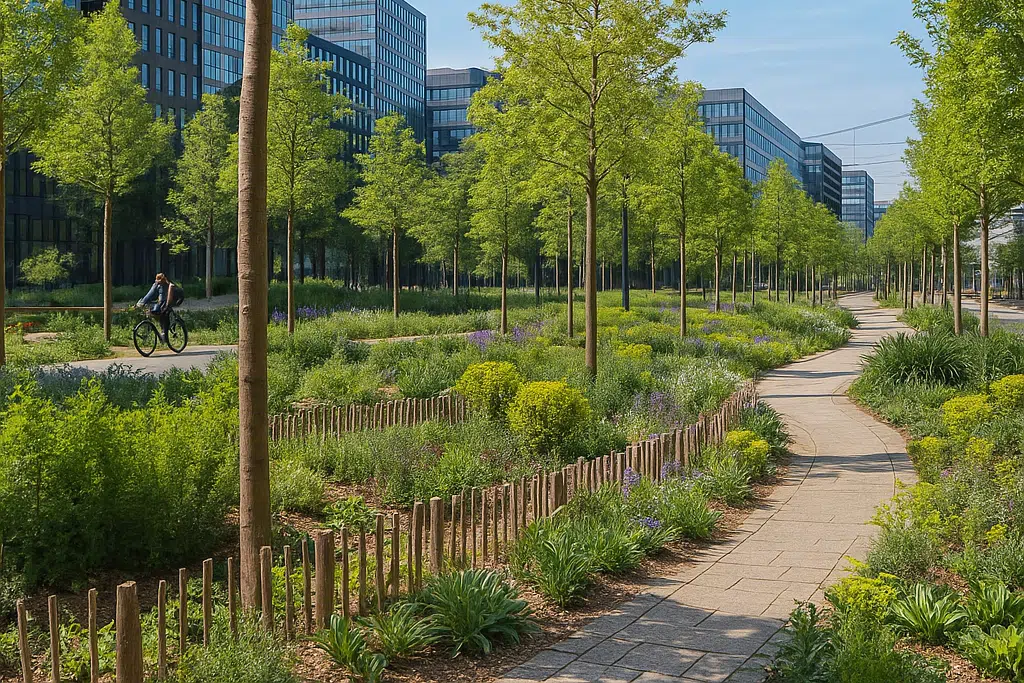
Faced with the intensification of urban overheating, nature-based solutions are powerful and durable levers. Integrated into the modelling, their effectiveness is assessed at the scale of a block or district: greening a mineral square, introducing denser tree cover, implementing green roofs or green façades, applying high-albedo coatings — each strategy is tested virtually in its real context.
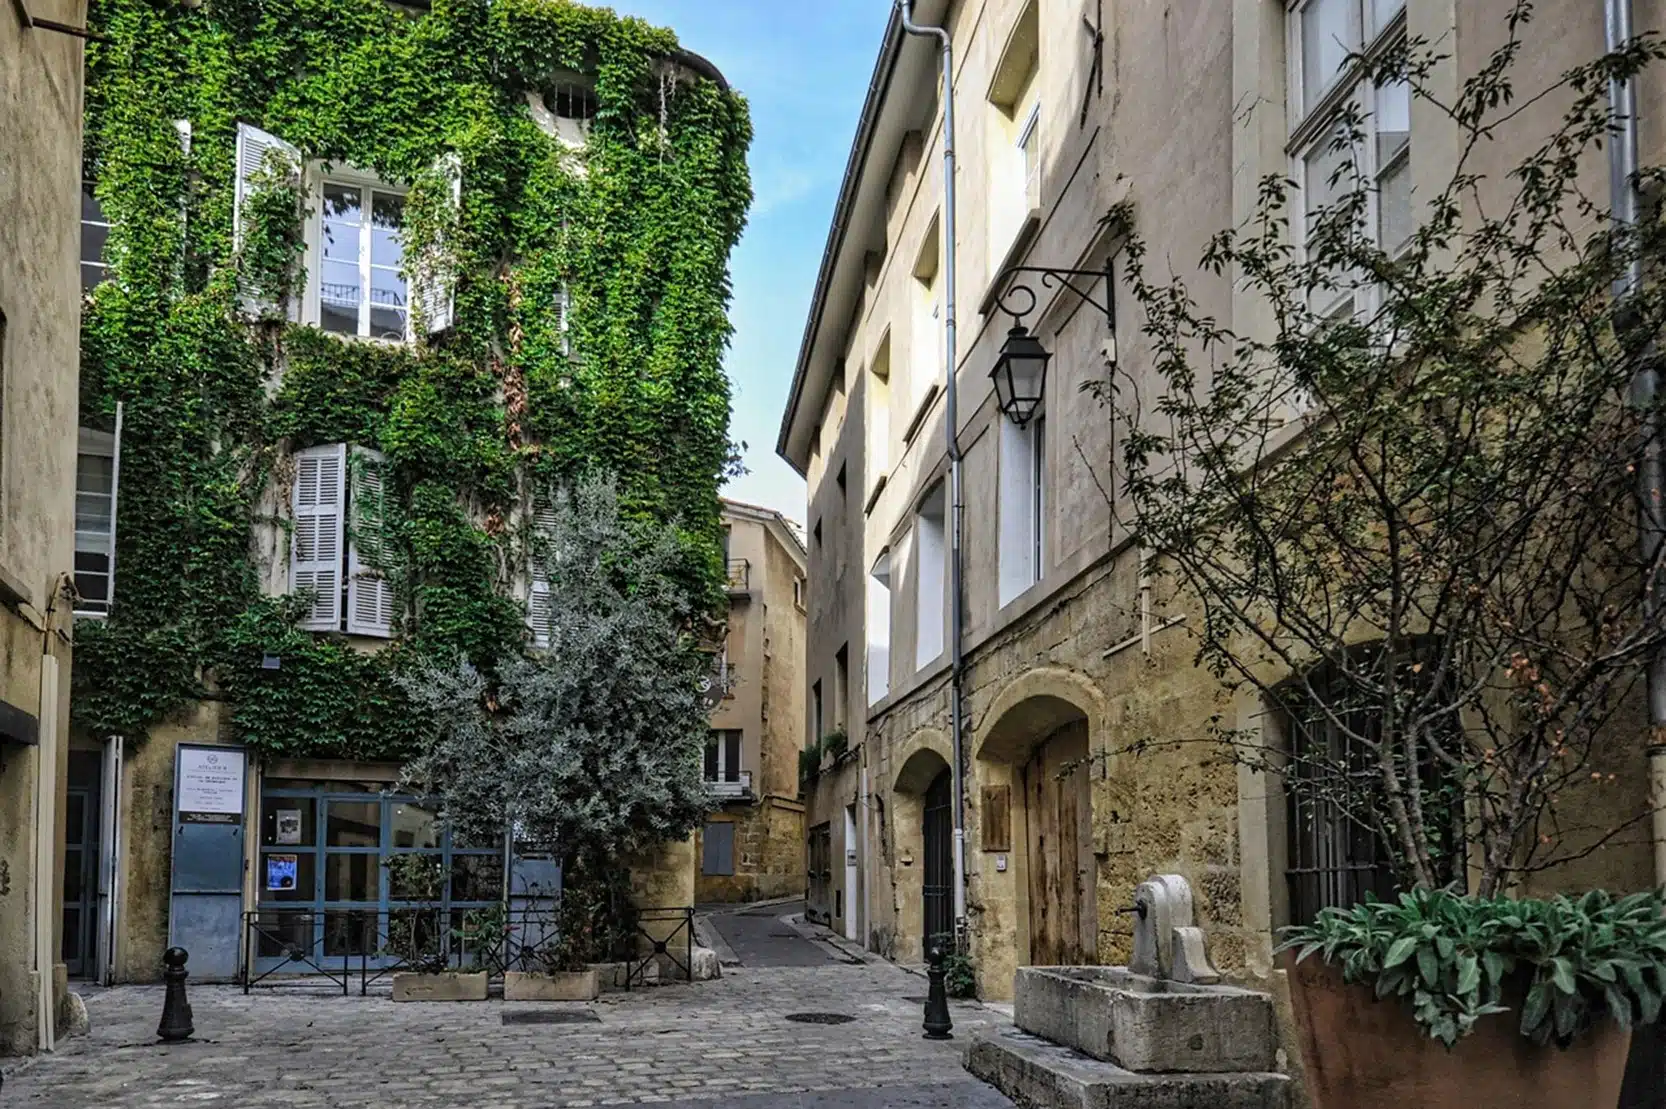
The simulations make it possible to visualise the expected thermal effects — lowering of surface and ambient temperatures, improvement of perceived comfort, increase in humidity or air renewal — taking into account the specificities of the site and its uses. Thanks to its combined expertise in urban thermal engineering, microclimate simulation and environmental planning, EOLIOS supports local authorities and designers with resilient, measurable and contextualised adaptation strategies.
Defining local climate action plans
The study of UHIs is part of a forward-looking territorial planning approach. Through microclimate modelling and the urban digital twin approach, it is possible to simulate how thermal conditions evolve under different scenarios: built-up densification, reduction of vegetated surfaces, change of ground materials, development of new districts. These analyses feed the PCAET (climate-air-energy plans), the bioclimatic PLUs (local urban plans) or the climate-adaptation roadmaps, offering a tangible view of medium- and long-term impacts and objectivising the planning trade-offs.
Supporting decision-makers in implementation
Producing indicators to guide public action
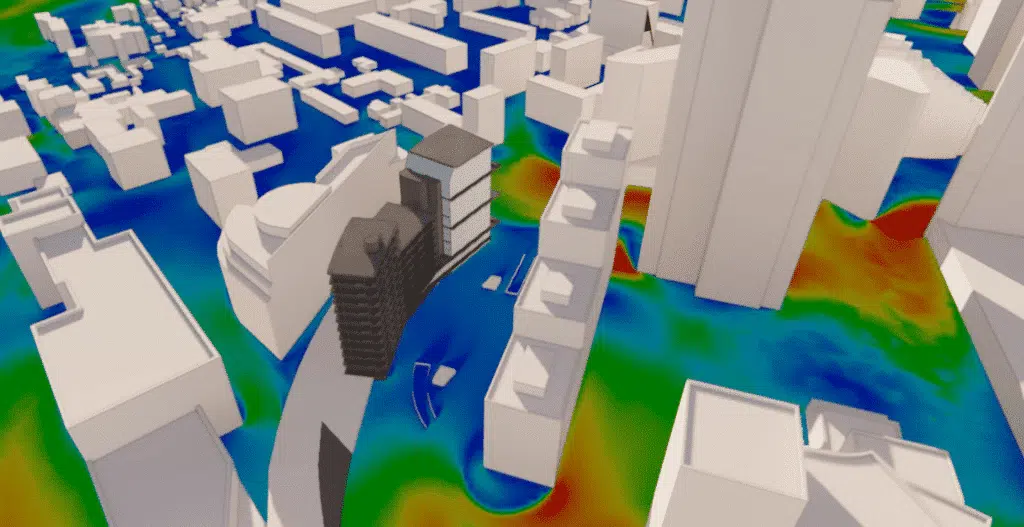
For an adaptation strategy to be relevant and monitored over time, it must rest on reliable, reproducible and readable indicators. Our microclimate simulation and cartographic visualisation tools produce directly usable indicators: intensity and extent of heat islands, evolution of perceived temperatures, thermal gain associated with greening.
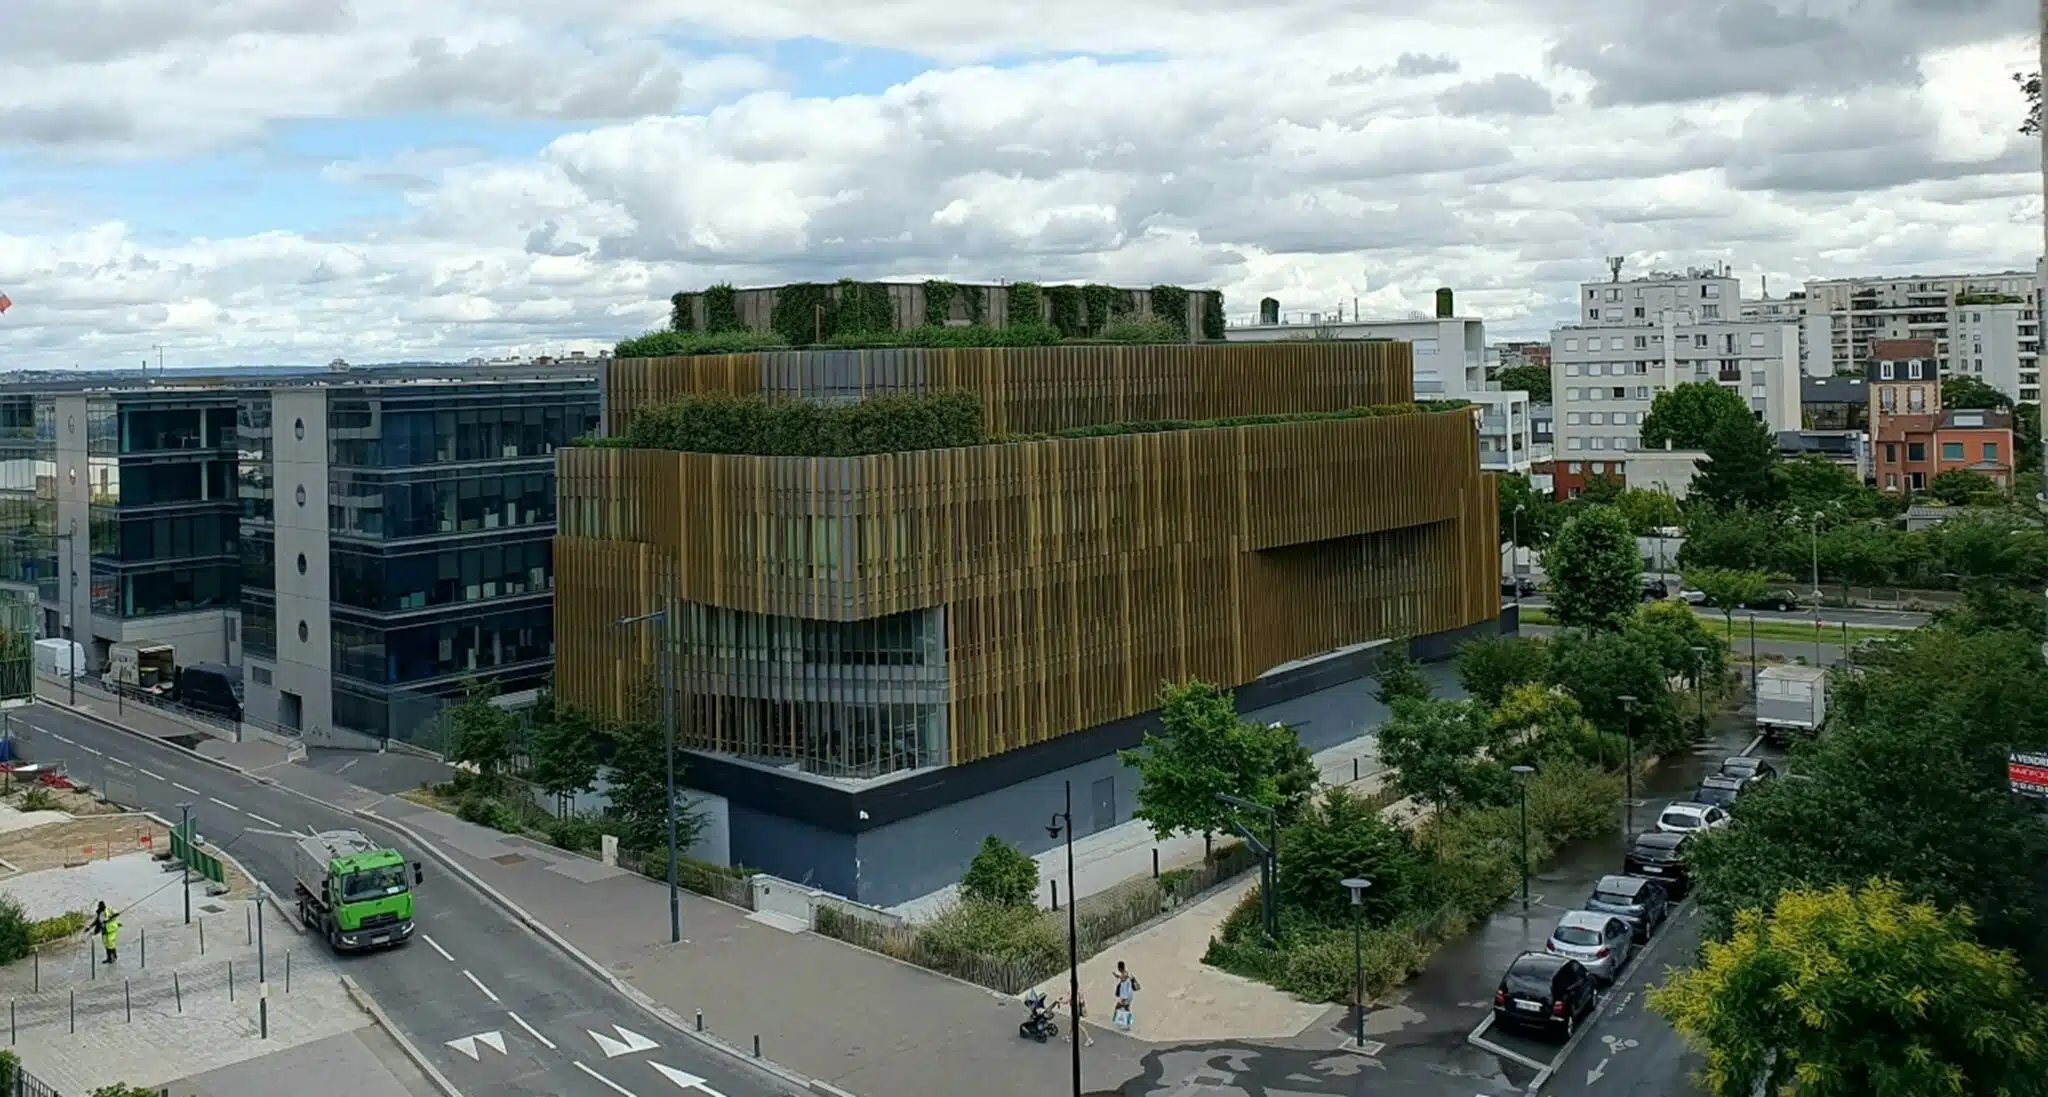
These data make it possible to compare different development scenarios, to prioritise and to monitor the effectiveness of the measures over time. They foster transparency and the ownership of climate issues by elected officials and citizens alike.
Facilitating consultation and awareness
One of the major obstacles to tackling UHIs lies in their diffuse nature, barely perceptible to the naked eye. To overcome it, we produce explicit visual representations — comparative thermal maps, illustrated cross-sections, video animations — that translate temperature differences, airflow and the effect of materials and greening in an intuitive way. These materials become powerful tools for dialogue in public meetings or consultations, strengthening support for the projects and the spread of a shared climate culture.