What is PUE?
The PUE, for Power Usage Effectiveness, is the reference indicator for measuring a data center's energy efficiency. It answers a simple question: for each kilowatt-hour actually useful to the servers, how much does the installation consume in total?
Introduced in 2007 by the The Green Grid consortium, PUE has established itself as the industry's common language. It has since been standardised internationally by the ISO/IEC 30134-2 standard, which fixes its definition, measurement scope and reading categories. Its success lies in its readability: a single, dimensionless figure, understandable by an operator and a general management alike.
The PUE is the ratio between the total energy consumed by the entire installation (servers, cooling, electrical distribution, lighting…) and the energy consumed by the IT equipment alone. It is a number greater than or equal to 1: the closer it gets to 1, the more efficient the data center.
PUE does not measure the performance of the servers themselves: it measures the energy overhead of the infrastructure surrounding them. A PUE of 1.5 thus means that for 1 kWh delivered to the IT, an extra 0.5 kWh goes to cooling, electrical losses and general services.
The PUE formula
The calculation relies on two quantities measured over the same period — ideally a full year, to capture the seasonal variations of the cooling.
IT energy: servers, storage and network equipment, measured as close as possible to their power supply.
Efficiency is sometimes expressed the other way round, via the DCiE (Data Center Infrastructure Efficiency): DCiE = 1 / PUE, expressed as a percentage. A PUE of 1.5 equates to a DCiE of about 67% — in other words, 67% of the energy actually reaches the IT.
A ratio, not a consumption
PUE is dimensionless. It says nothing about the size of the data center or the efficiency of the servers: it only qualifies the efficiency of the infrastructure. Two centers with an identical PUE can have very different absolute consumptions.
How to read a PUE?
A PUE only makes sense relative to orders of magnitude. The global average, measured each year by the Uptime Institute, has stagnated around 1.5 to 1.6 for several years, after a strong improvement in the 2010s. The best hyperscale operators reach 1.1, or even less, thanks to free cooling and an end-to-end optimised design.
| PUE | Efficiency level | Typical installation profile |
|---|---|---|
| 1.0 – 1.2 | Excellent | Hyperscale data centers, free cooling, liquid cooling, optimised new-build design |
| 1.2 – 1.4 | Very good | Well-designed recent centers, widespread aisle containment, favourable climate |
| 1.4 – 1.6 | Average | Global average fleet, rooms correctly operated but improvable |
| 1.6 – 2.0 | To optimise | Ageing installations, no containment, oversizing |
| > 2,0 | Critical | Old premises not designed for IT, poorly controlled cooling, heavy under-load |
Caution: a low PUE can only be honestly compared under equivalent conditions. The local climate, the load factor, the level of redundancy and the measurement scope strongly influence the value. A Nordic center using free cooling will always start with a structural advantage over a center in a hot, humid zone.
The PUE measurement categories
The whole credibility of a PUE rests on where and how it is measured. The ISO/IEC 30134-2 standard, heir to the The Green Grid categories, distinguishes several levels of rigour, from the most approximate to the most reliable. The closer the IT-energy measurement point is to the servers, the more representative the PUE.
Category 1 — measurement at the UPS output
The IT energy is read at the UPS output, often from a spot reading or the peak load. Simple, but it overestimates the useful energy (the losses of the PDUs and cabling are counted as IT) and therefore understates the real PUE.
Category 2 — measurement at the distribution boards (PDU)
The reading goes down to the level of the power distribution units, as close as possible to the cabinets. The distribution losses are better isolated from the IT: the measurement gains in precision.
Category 3 — measurement at the IT equipment inlet
The energy is measured at the inlet of the servers themselves, continuously over the year. It is the most reliable and most demanding measurement: it faithfully reflects the real efficiency of the whole energy chain.
In all cases, the golden rule is continuous measurement over 12 months: a PUE read on a winter's day has nothing to do with the same center in the middle of a summer heatwave, when the cooling is running at full capacity.
Where does a data center's energy go?
Understanding PUE means first understanding what hides in the non-IT “overhead”. In a center with a PUE ≈ 1.6, the non-IT energy breaks down roughly as follows:
Cooling
- First non-IT item, often 30 to 40% of the total energy
- Chillers, CRAC/CRAH, pumps, cooling towers, fans
- It is the main optimisation reserve
Electrical distribution
- Losses of the UPS, transformers, MSB and PDUs
- Typically 8 to 12% depending on the efficiency and the load factor
- Optimisable with high-efficiency UPS and eco mode
General services
- Lighting, security, supervision, ancillary rooms
- A smaller but non-negligible share over the year
- Quick gains via LED and control
The hierarchy is clear: acting on the cooling is by far the most powerful lever to bring down a PUE. This is precisely where airflow and thermal simulation brings the most value.
Paper: the cooling systems of data centersThe PUE optimisation levers
Reducing a PUE almost never comes from a single measure, but from the accumulation of gains across the whole chain. Here are the most effective levers, from the most cost-effective to the most structural.
1. Control the airflows
Hot- and cold-aisle containment, blanking the free spaces in the cabinets (blanking panels) and a good pressure balance avoid bypass (wasted cold air) and recirculation (hot air returning to the servers). It is the fastest and least costly gain.
2. Raise the temperature setpoints
The wider ranges recommended by ASHRAE allow higher supply temperatures than before. Each degree gained on the setpoint opens up more hours of free cooling and reduces the chillers' bill.
3. Exploit free cooling
“Free” cooling — air-side (outside air) or water-side (water) — makes it possible, in a favourable climate, to switch off the chillers for a large part of the year. It is the main factor behind the record PUEs of Nordic centers.
4. Move to liquid cooling
For high densities (AI, HPC), direct-to-chip and immersion remove heat far more efficiently than air and drastically reduce the cooling energy — while opening the way to waste-heat recovery.
5. Make reliable without oversizing
A heavily under-loaded center degrades its PUE: the UPS and chillers run far from their optimal efficiency point. Sizing as tightly as possible, in modules, maintains efficiency at every stage of load ramp-up.
The role of CFD simulation
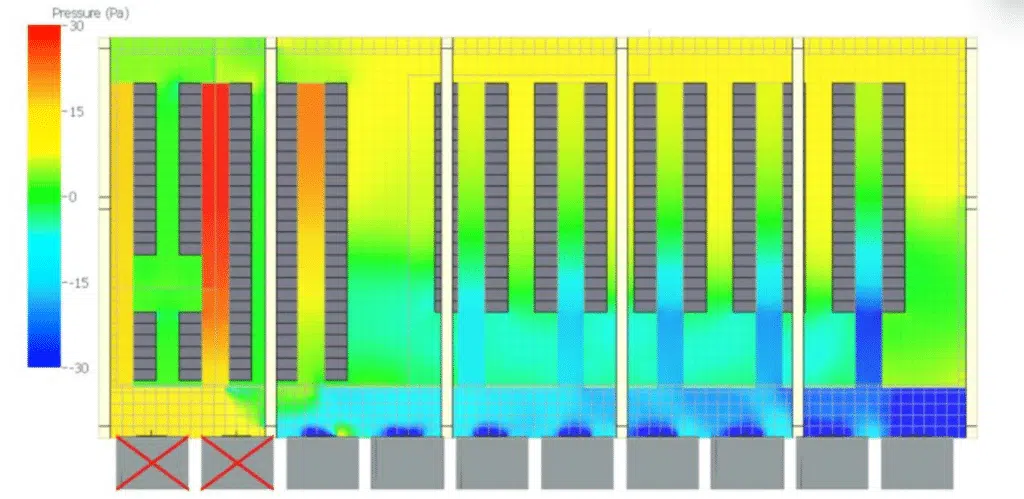
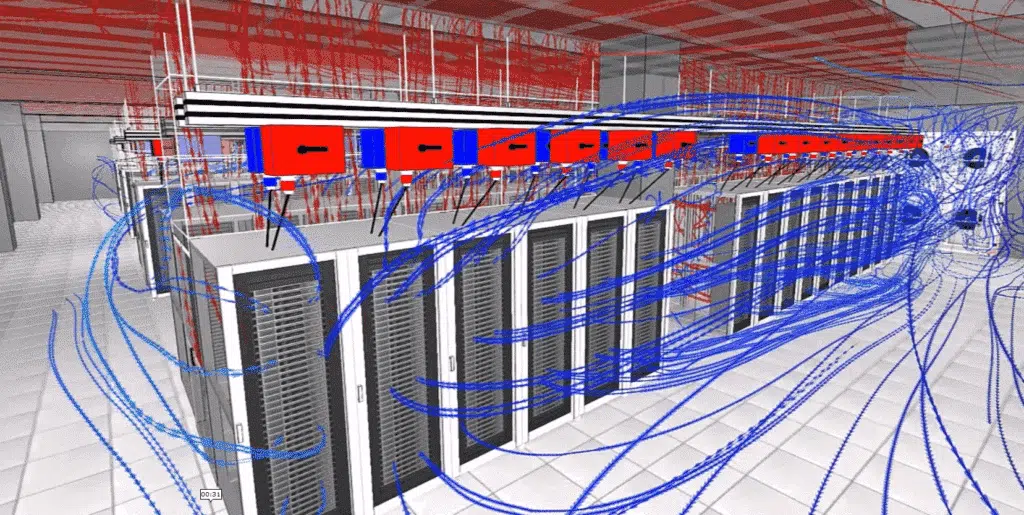
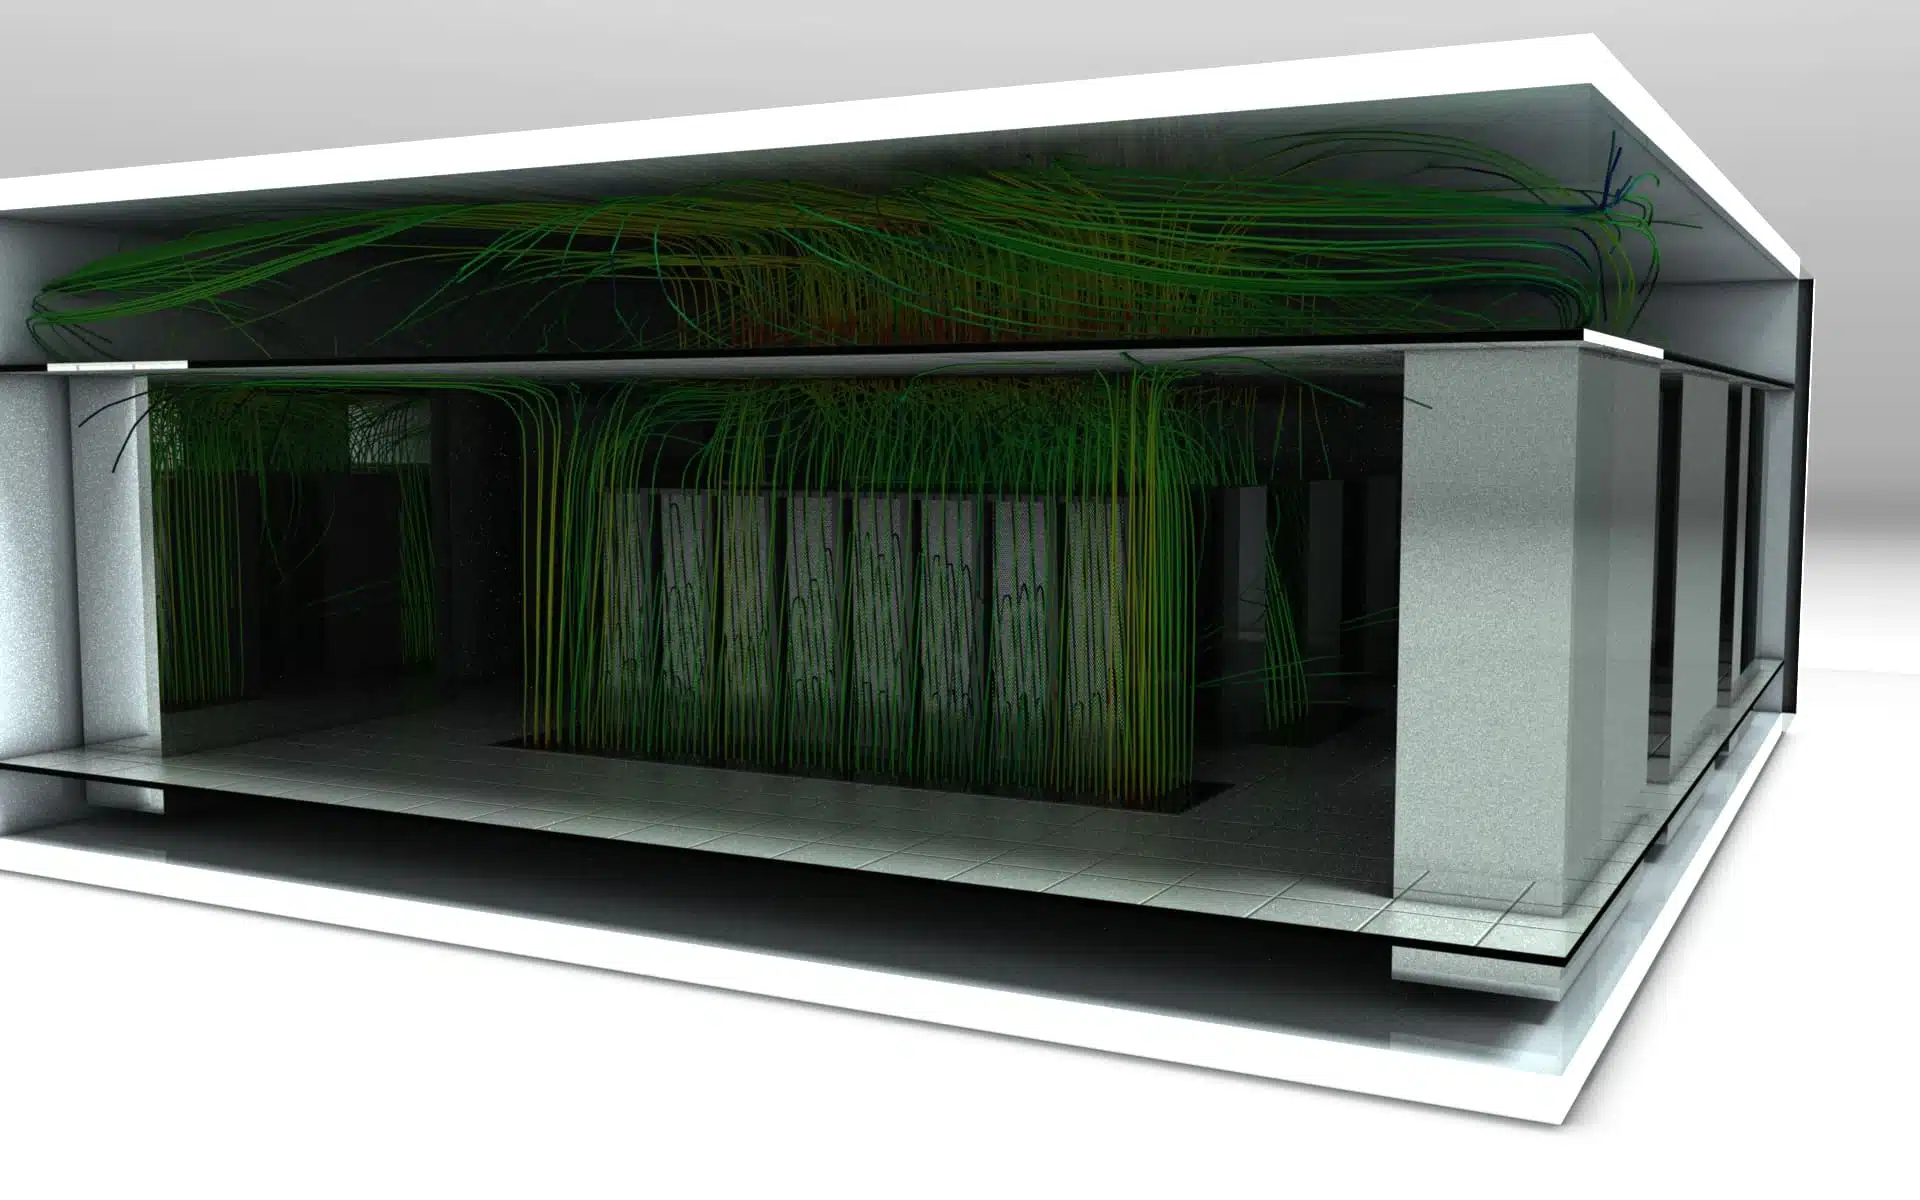
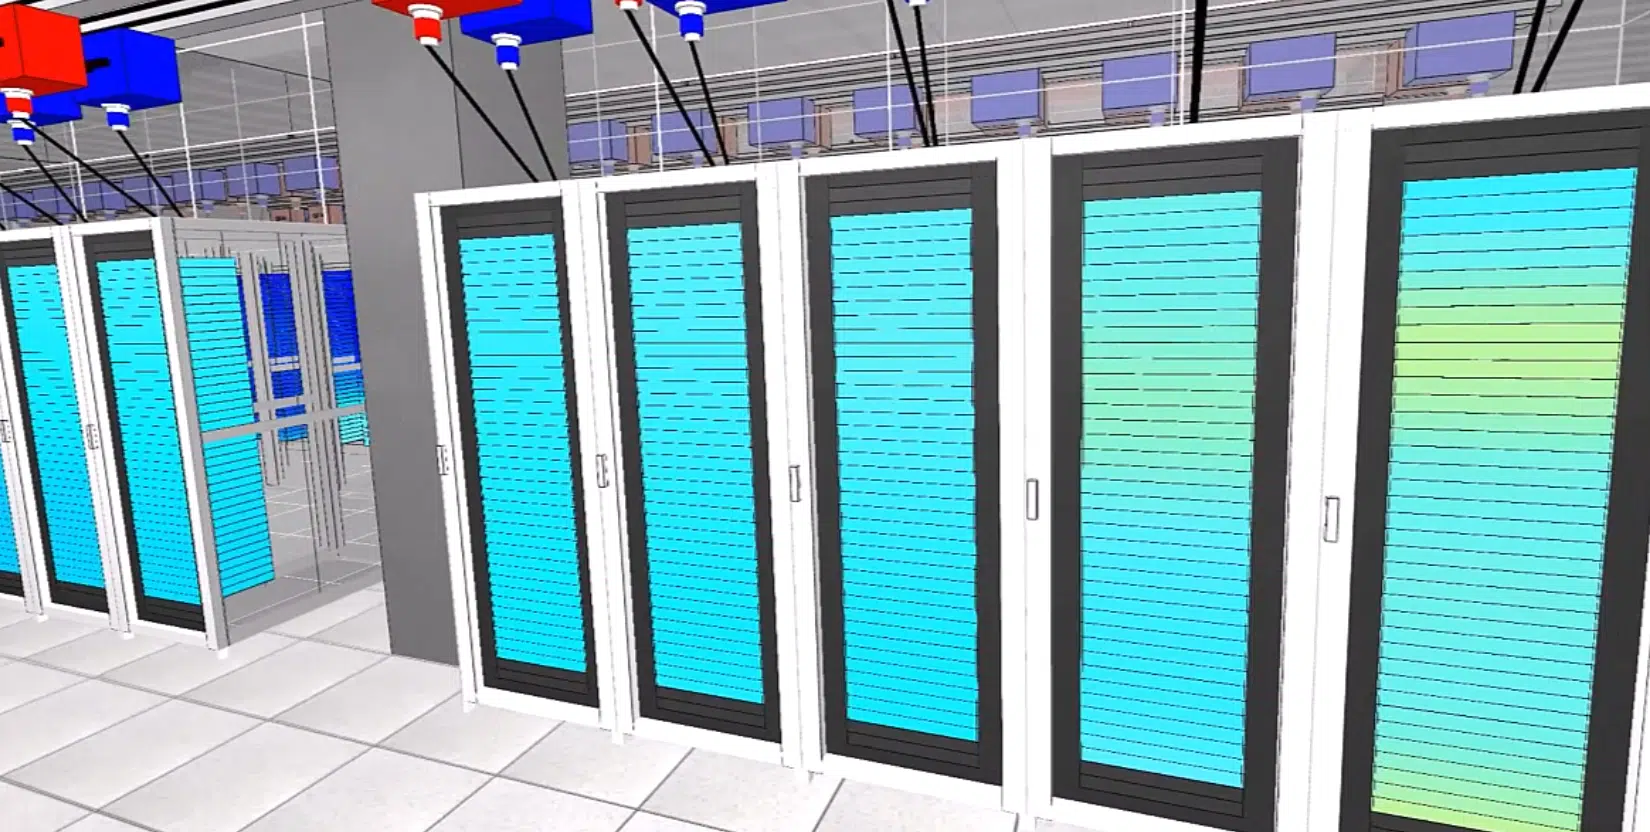
All these levers have one thing in common: they play out in the airflow and thermal behaviour of the room. Yet the eye cannot see air. CFD simulation (computational fluid dynamics) makes visible and quantifiable what determines the PUE: velocity, pressure and temperature fields at every point.
By reconstructing a digital twin of the data center, EOLIOS assesses the impact of each decision before works: positioning of the supply units, type of containment, temperature setpoint, failure or heatwave scenarios. The cooling — the first item of the PUE — is thus optimised without costly trial and error on site.
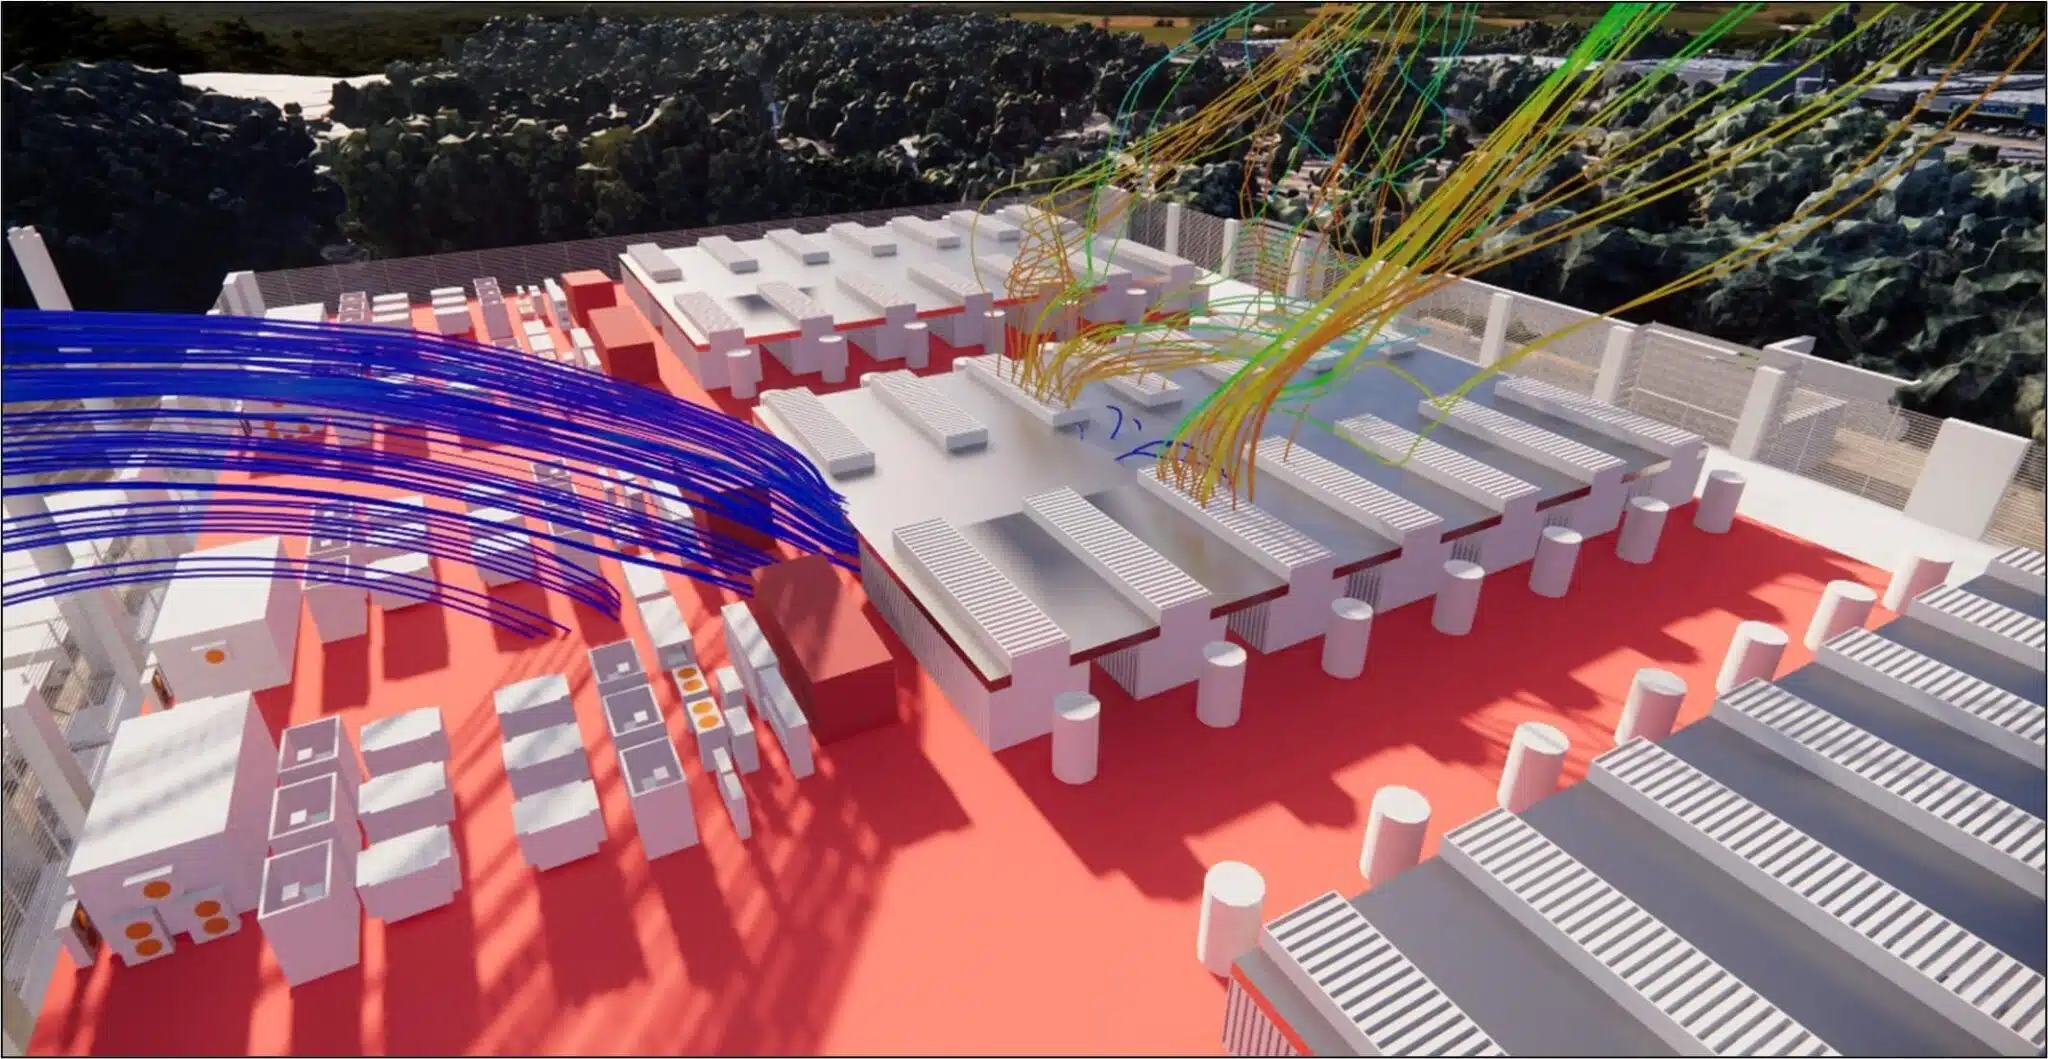
From diagnosis to a quantified PUE gain
CFD makes it possible to map the hot spots, quantify the bypass and recirculation, then numerically validate the solutions (containment, setpoints, flow rates) before any investment — for a PUE optimised from the design stage.
Calculate your PUE
Enter the total energy consumed by your installation and the energy of the IT equipment over the same period (ideally 12 months) to estimate your PUE, the corresponding DCiE and the share of non-IT energy. The buttons offer a few reference profiles.
PUE calculator
Indicative estimate — a real diagnosis relies on continuous measurement over 12 months (category 3).
PUE = total energy / IT energy, measured over the same period. The IT energy cannot exceed the total energy.
The complementary indicators
PUE does not say everything. It ignores water, carbon and heat reuse. A complete reading of a data center's performance therefore involves a family of indicators.
| Indicator | Measure | What it reveals |
|---|---|---|
| PUE | Total energy / IT energy | Overall efficiency of the infrastructure |
| DCiE | 1 / PUE (en %) | Same information, expressed as efficiency |
| pPUE | Partial PUE of a zone | Efficiency of an isolated room or module |
| WUE | Water consumed / IT energy | Water footprint (evaporative cooling) |
| CUE | CO₂ emitted / IT energy | Carbon footprint of the energy used |
| ERE / ERF | Share of heat reused | Recovery of waste heat |
The WUE has become central: some strategies that improve the PUE (adiabatic cooling) increase water consumption. Optimising a data center therefore means arbitrating between these indicators — a task where simulation helps find the right balance.
The PUE measurement pitfalls
A PUE displayed without caution can be misleading. Here are the most common biases.
Le PUE « marketing »
- Spot value read in cold weather, ideal load
- Vague or advantageous measurement scope
- Without mention of the measurement category
Under-load
- A new, lightly filled center shows a degraded PUE
- The equipment runs outside its optimal efficiency
- The PUE improves as the load ramps up
The climate effect
- Strong dependence on the local weather and the season
- Comparing two sites in different climates is misleading
- Only the annual measurement smooths these differences
The IT blind spot
- The PUE does not judge the efficiency of the servers
- Efficient servers can “degrade” the PUE…
- …while reducing the total consumption!
Good practice: always specify the measurement category, the period and the scope — and cross-reference the PUE with the other indicators for a faithful picture.
PUE & regulation
Long voluntary, PUE tracking is gradually becoming an obligation. Several frameworks govern it or refer to it:
ISO/IEC 30134-2 & EN 50600
International standardisation defines the PUE and the EN 50600 series structures the design and energy operation of data centers.
EU Code of Conduct for Data Centres
European code of good conduct: it sets PUE targets and a catalogue of energy-efficiency best practices.
European Energy Efficiency Directive (EED)
It introduces a reporting obligation for data centers above a certain power threshold, of which the PUE and the WUE are part.
Recommandations ASHRAE (TC 9.9)
Global technical reference for the admissible temperature and humidity ranges — the basis of any trade-off between reliability and PUE.
Beyond compliance, these frameworks make the PUE a competitive argument: clients and investors now scrutinise energy efficiency as a selection criterion.
Frequently asked questions about PUE
What is a good PUE?
How is PUE calculated?
What is the difference between PUE and DCiE?
Is a PUE of 1.0 achievable?
How does CFD help reduce the PUE?
Our CFD engineers diagnose your installation and quantify the achievable gains, scenario by scenario, before any investment.