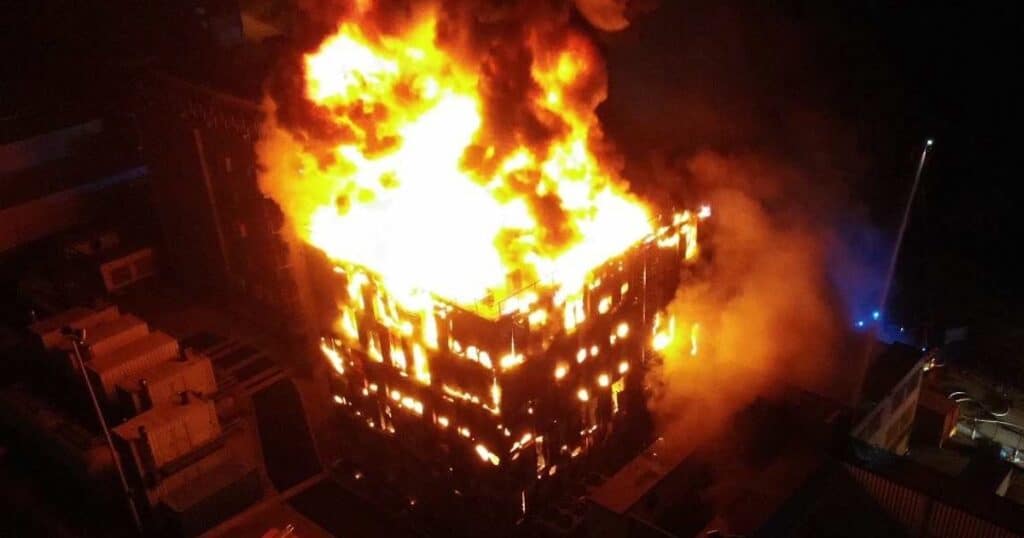
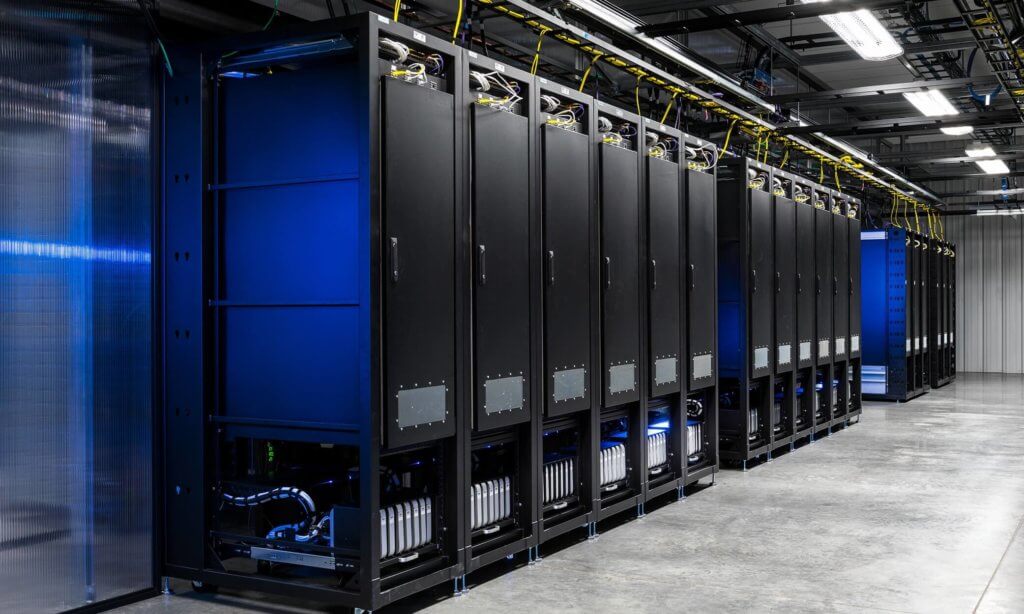
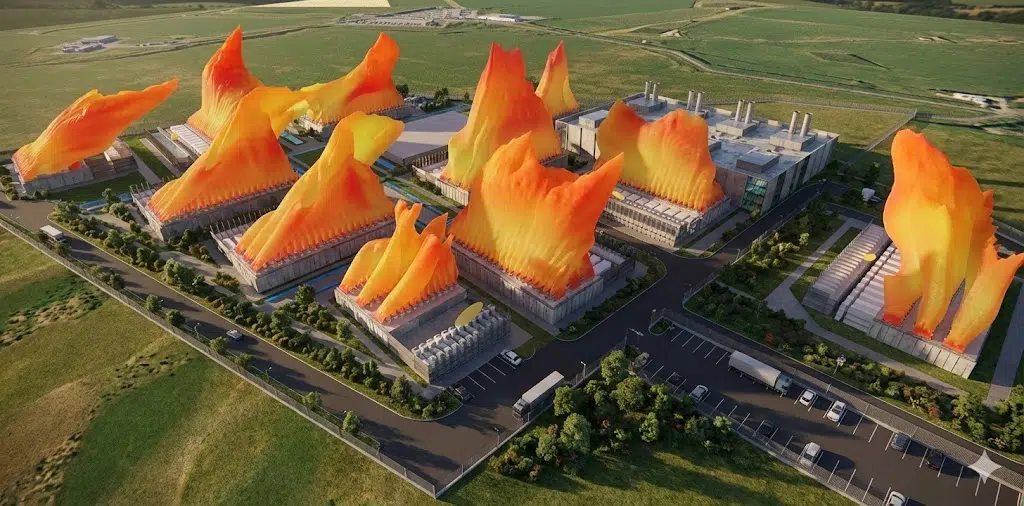
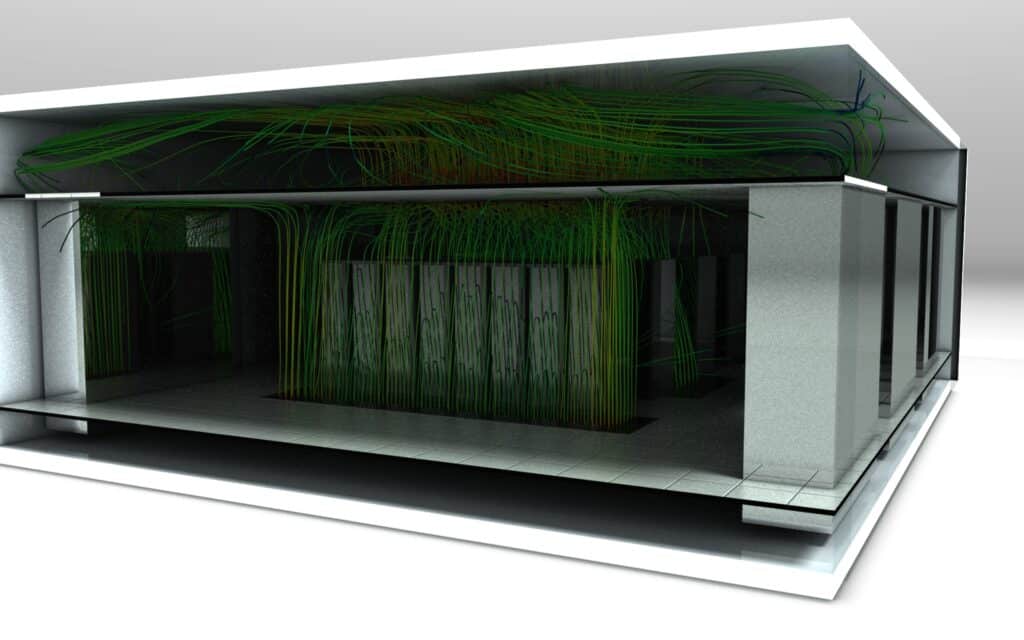
Server room of a data center modelled in CFD
Home/Data Center/Internal CFD of server rooms
Expertise · Data Center

Internal CFD of server rooms.

Every IT room has its own airflow signature. CFD simulation reconstructs it in 3D to track hot spots, guarantee the inlet air temperature of every rack and virtually test any change before carrying it out.

CAT / SIT hyperscale criteriaFailure scenariosHigh density & DLCReading a few minutes
Scroll
Rack-by-rack compliance

Inlet air temperature validated across the ASHRAE 18–27 °C range, not on a room average.

Crisis scenarios

CRAH failures, power cuts and restarts simulated in transient before construction.

High density under control

Capacity assessment, mix cooling (air / DLC / cold doors) and containment arbitrated realistically.

01 — Challenges

Why simulate the inside of a server room?

Internal CFD simulation of server rooms is the historic core of EOLIOS: more than 350 data centers studied across 20 countries. We work on every type of room, from the hyperscale data hall to the enterprise or colocation room, in design as well as on existing sites, which we audit and model. Because an IT room’s cooling can be correctly sized in terms of power and yet fail locally: everything comes down to the distribution of the air.

Global thermal balances guarantee that the installed cooling power covers the dissipated power. They say nothing about what matters most: the temperature of the air that actually enters each server. Between the cooling unit and the rack, the air mixes, bypasses and recirculates; two neighbouring racks can draw in air 10 °C apart. It is this invisible path that CFD simulation makes visible.

What the global calculation cannot see

  • Local hot spots. A rack at the top of a row can exceed the ASHRAE range while the room average stays compliant.
  • Airflow waste. Cold air that reaches the return without having crossed a server is energy spent for nothing.
  • Layout effects. A moved perforated tile, an unblanked empty rack or a cable tray is enough to change the behaviour.
  • Failure behaviour. The time available before overheating when a unit stops cannot be guessed, it is computed in transient.

What internal CFD simulation secures

Diagnosis

  • Inlet air temperature of each rack
  • Hot spots located and explained
  • Bypass and recirculation quantified

Analysis

  • Worst failure identified, redundancy validated
  • Power cut followed minute by minute
  • Densifications and setpoints tested

Design

  • Aisle layout and floor planning
  • Containment arbitrated on your geometry
  • Air / DLC mix validated, not just drawn
Benchmark

The ASHRAE range, a contractual reference

The ASHRAE TC 9.9 recommendations set the intake range of class A1 to A4 equipment between 18 and 27 °C. This is the criterion the simulation checks rack by rack, far more demanding than a room average.

02 — Airflow

The airflow of a server room

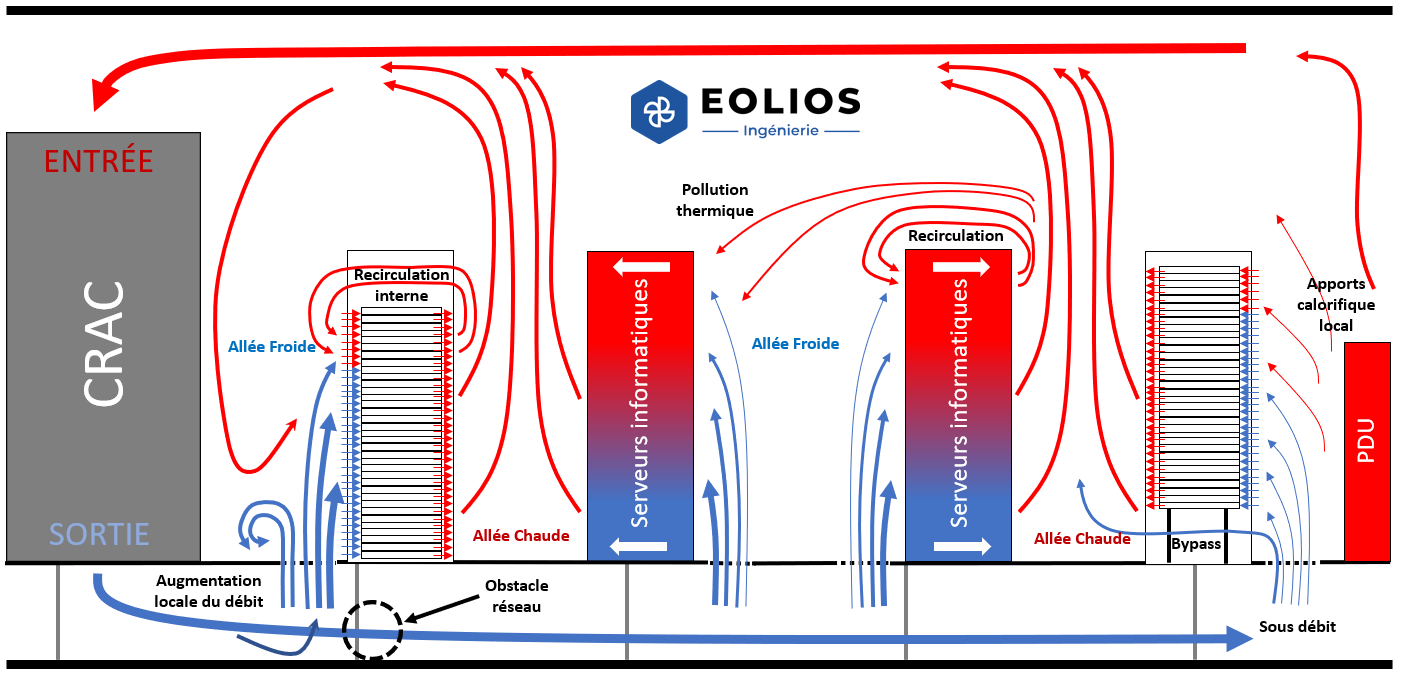
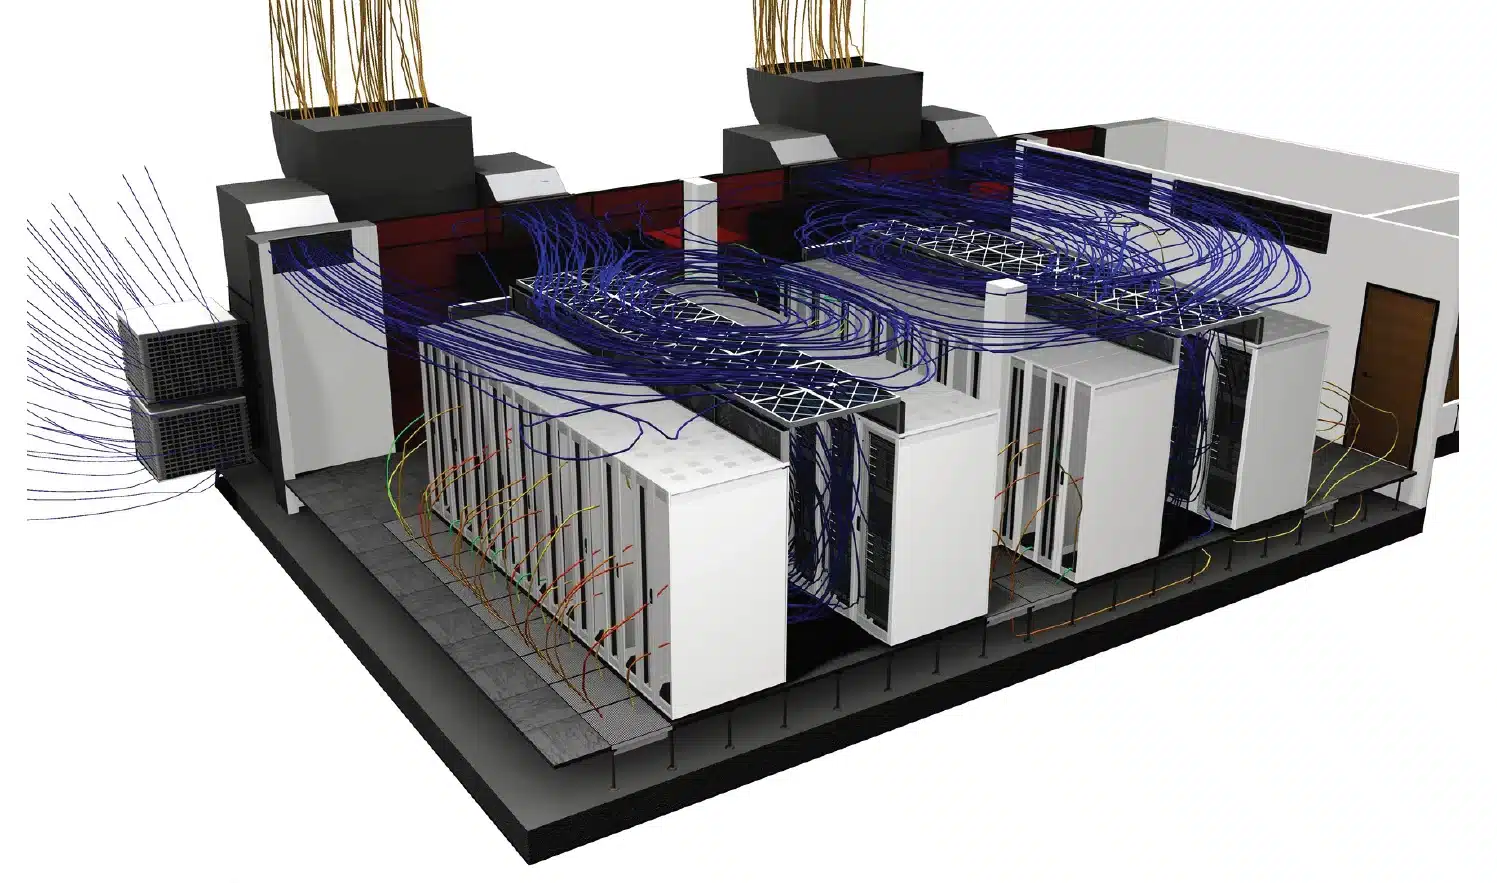
The reference layout separates the flows into cold aisles, where fresh air is supplied in front of the racks’ front faces, and hot aisles, which collect the air exhausted at the rear. The raised-floor plenum, the perforated tiles and the CRAC/CRAH units close the loop.

Diagram of air circulation in a data center
Diagram of air circulation, from the plenum to the hot aisles
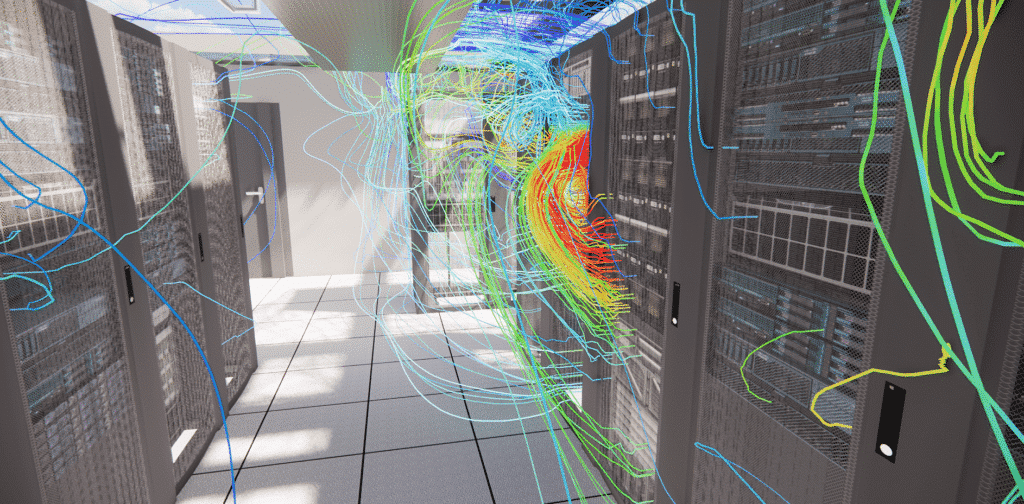
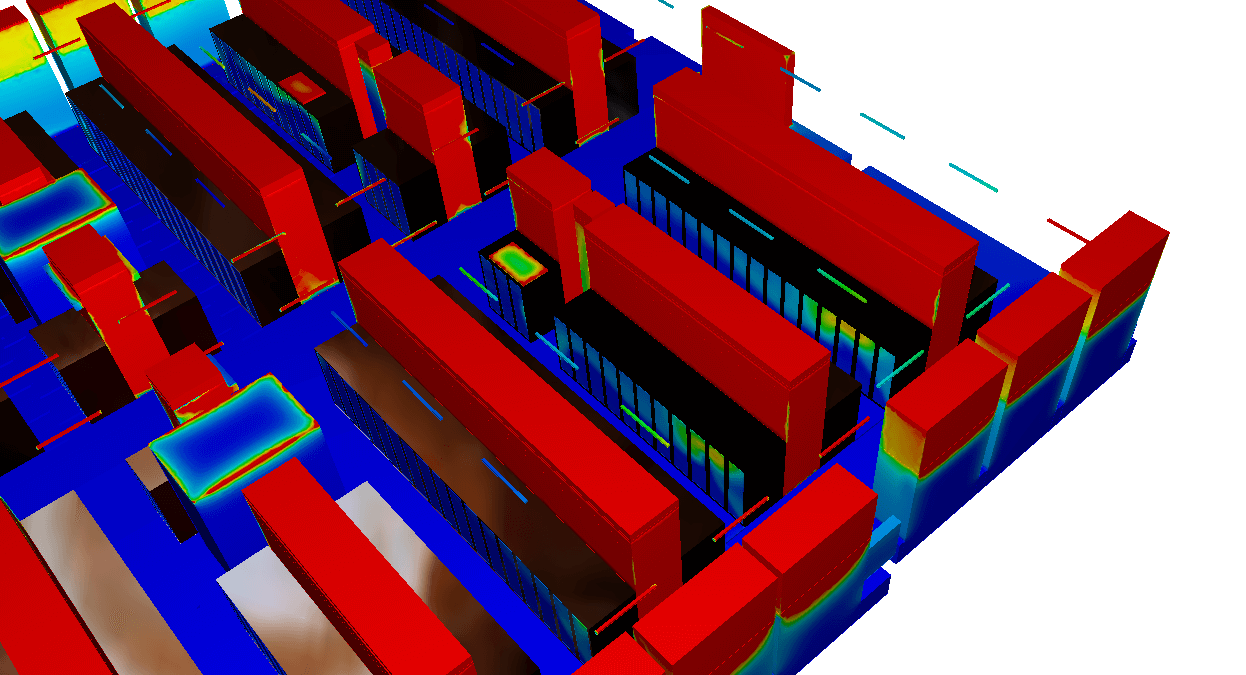
Identification of hot spots at the server inlet
CFD simulation — hot-spot search

This separation is never perfect. Two phenomena degrade it, and these are exactly what CFD quantifies precisely.

The thermal reading: bypass, recirculation and hot spots

Bypass

  • Cold air reaches the return directly without crossing a server: badly placed tiles, excessive overpressure, floor leaks. Cooling energy lost.

Recirculation

  • Hot air flows back to the intakes, over the racks or through the free U slots: this is the mechanism that forms hot spots, at the top of the rack in particular.
The invisible gap
10 °Ccan separate the air drawn in by two neighbouring racks, in a room that is nonetheless compliant on average.

“Do you know what temperature actually enters your most exposed rack?”

Top of rackrecirculation strikes the upper U slots first, far from the aisle probes
End of rowrow ends draw in the hot air that bypasses the separation
Misleading averagea room compliant on average can hide racks out of range

The pressure reading: the cold-aisle / hot-aisle differential

Definition · Pressure differential

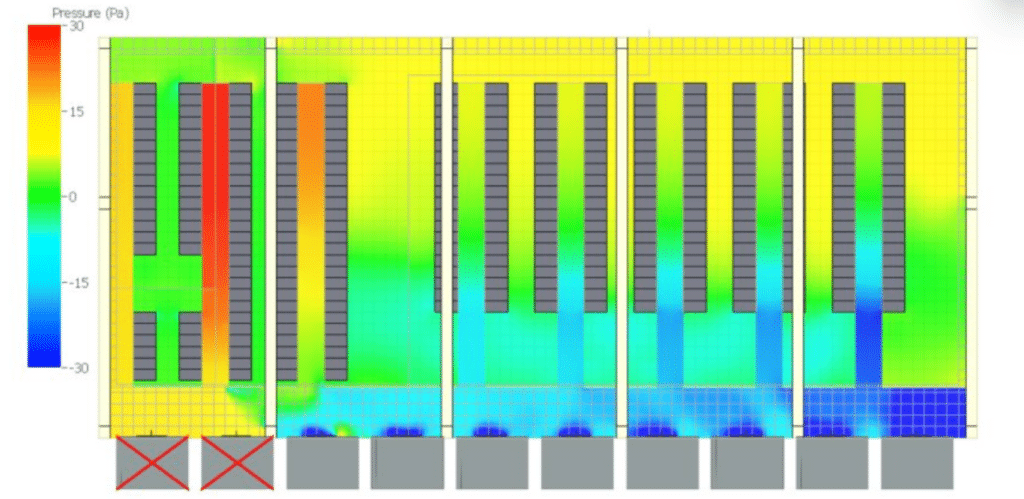
Air always flows from the high-pressure zone towards the low-pressure zone. Keeping the cold aisle at a slight overpressure relative to the hot aisle, of the order of a few pascals, ensures that fresh air actually crosses the racks instead of bypassing them. The pressure field is the key to reading a room: it is the first thing CFD restores.

A few pascals are enough to tip a room from one regime to the other, and that is the whole point of the adjustment: too little pressure on the cold side and hot air flows back to the intakes, too much pressure and cold air short-circuits the servers to return straight to the return. The gauge below sums up this reading, the one our engineers apply from the very first calculation, unit by unit and tile by tile.

Cold-aisle / hot-aisle pressure differentialPa · scale −4 → +12
−2 PaDepression: recirculation +3 PaSlight overpressure: the target +10 PaExcessive overpressure: bypass
Fresh air crosses the racks when the cold aisle stays at a slight overpressure. In depression, hot air flows back to the intakes; in excessive overpressure, cold air bypasses the servers and returns straight to the return. Indicative values.
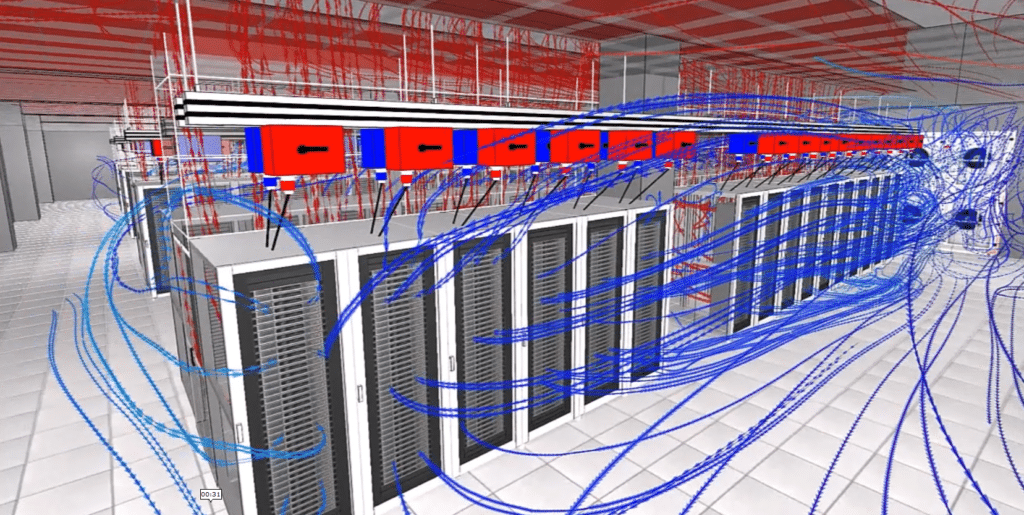
Pressure map of a hyperscale server room simulated in CFD
Pressure field of a hyperscale room — imbalances reveal bypass and recirculation
03 — Model

What the CFD model reconstructs

The model reproduces the room as it is, or as it will be: geometry, equipment and operating regimes. It then solves the fluid-mechanics equations over millions of cells to restore the velocity, temperature and pressure fields at every point.

The ingredients of the model

  • Full geometry. Racks, aisles, raised floor and its clutter (cables, pipes), false ceiling, obstacles.
  • Active equipment. CRAC/CRAH or InRow units with their flow rates and setpoints, server fans, perforated tiles with their permeability.
  • Real loads. Power dissipated rack by rack, including heterogeneous or partially equipped racks.
  • Containment devices. Doors, roofs, blanking panels, curtains, with their real leaks.
  • Realistic leaks. No containment is airtight: the model includes a documented leakage rate, distributed around the racks and at the containment junctions.
  • Thermal mass. Slab, steel frame of the racks, servers, cooling units and false ceiling: essential as soon as the transient calculation is run.
Typical assumptions · hyperscale standards
IT load90 to 100 % of the room’s contractual capacity, uniform or heterogeneous distribution across the racks
ContainmentHot aisle by default, leaks taken into account around the racks and at the containment junctions
AirflowSupply flow indexed on the installed IT power, server ventilation and leaks included
SensorsSetpoint read in the cold aisle at the height of the supervision sensors (BMS)
Thermal massSlab, rack frames, servers, false ceiling: accounted for in the transient
WeatherASHRAE design day: dry- and wet-bulb temperature extremes, 50-year return period
Default assumptions of colocation specifications, adjusted to each site’s real data: datasheets of the grilles and diffusers, supply-fan gains, operating sequence.

The quality of the result depends on the fidelity of these inputs. On an existing room, a measurement campaign (temperatures, flow rates, thermography, smoke tests) makes it possible to calibrate the model: the digital twin first reproduces the observed state, then serves as a reliable test bench for changes. This step is by no means mandatory: on a new project, the model works directly from the drawings and the manufacturer data.

3D CFD mapping of the hot spots of a server room
Hot-spot search — 3D mapping
“The airflow of a raised-floor grille can vary by more than 50 % depending on its position, the room configuration and its distance from the air-conditioning systems.”
Learn more: the data center digital twin
04 — Criteria

ASHRAE, CAT, SIT: the criteria that count

A room is not judged “on average”. The CFD standards of the major colocation and hyperscale operators rest on two normalised temperatures, which every simulated case must respect.

Definition · SIT (Server Inlet Temperature)

Temperature of the air that enters each server, at its front face. This is the most demanding criterion: it tolerates no hot spot, however localised, even at the top of the last rack in the row.

Definition · CAT (Cold Aisle Temperature)

Temperature measured at the centre of the cold aisle, at the height of the supervision (BMS) sensors. This is the criterion readable in operation, the one the control setpoints rely on.

The exact thresholds vary from one operator to another and depend on the cooling mode: stricter for chiller-based architectures, widened for free cooling and evaporative cooling. All of them fit within the public ASHRAE TC 9.9 framework: the recommended range of 18 to 27 °C, then the allowable ranges of classes A1 to A4 that permit controlled excursions. In every case, compliance is judged with N cooling units, redundancy being consumed, on humidity as well as temperature; in transient, a higher tolerance applies, but strictly timed.

Server inlet temperature (SIT)°C · scale 20 → 40
27 °CASHRAE recommended limit 32 °CAllowable limit · class A1 35 °CAllowable limit · class A2
Below 27 °C, the room is within the ASHRAE recommended range. Beyond it, the allowable ranges of the equipment classes are consumed: each operator standard places its own thresholds there, in regime N as in transient.

The restitution by SIT bins

The report does not stop at a minimum and a maximum: each rack is classified by SIT bin, case by case. This reading shows at a glance how many racks are compliant, how many live on the margin and where the exceedances are concentrated.

SIT summary · racks classified by bin
Nominal case · all unitsHigh density · N units
≤ 27 °C100 %80 %
27–32 °C0 %12 %
32–35 °C0 %7 %
> 35 °C0 %1 %
Example of a restitution, illustrative values: share of the racks per temperature bin. The verdict is read at a glance, how many racks are out of range, in which case, and by how much.
05 — Scenarios

Scenarios: the cascade of cases, from nominal to the worst failure

The nominal regime

The first calculation establishes the reference mapping: inlet air temperature of each rack, flow rates actually delivered by each tile, pressure balance. It reveals the existing hot spots and prioritises the corrections: tile adjustment, blanking of free U slots, flow rebalancing, containment, down to fine tuning such as grille placement, CRAC/CRAH setpoints or the chilled-water temperature.

The typical questions the simulation settles

  • Backup. Will the backup air conditioners hold the load if a main unit fails?
  • Densification. What happens if a high-density rack is added to this row?
  • Layout. Would the room work better with a different IT arrangement or a different cooling mode?
  • Setpoints. What becomes of compliance if the supply-air or chilled-water temperature rises?

The cascade of cases from the hyperscale standards

The CFD specifications of hyperscale and colocation operators leave no choice of scenarios: they impose a cascade approach, where each case inherits from the previous one and answers a precise question. Our studies follow it natively.

Typical cascade · internal CFD study
C1Average density, all cooling units in serviceIs the room compliant rack by rack in nominal regime?Steady
C2Average density, N units: the worst failure soughtWhich combination of shutdowns, mechanical or electrical, penalises the room most?Steady
C3High-density racks at the most unfavourable positionsDo the weak spots identified in C2 accept the maximum racks?Steady
C4Spacings and mix of densitiesWhich floor plan makes the deployment compliant: spacing, dedicated rows, mixing?Steady
LCHybrid air / liquid-cooling roomIs the residual airflow enough for the racks still air-cooled?Steady
TRPower cut and generator failure at start-upHow many minutes before the critical thresholds, and how do we return to nominal?Transient
Each case inherits from the previous one: the units stopped in C2 stay off in C3 and C4, and the whole is simulated under the worst case of the external CFD.

Failure scenarios

A room compliant in nominal regime can tip over within minutes as soon as a piece of equipment stops. The simulation first assesses common operational failures: loss of one or more cooling systems, shutdown of a unit for maintenance, closure of a damper. The search for the worst case is systematic: a unit is not removed at random, several combinations of shutdowns are re-simulated, including electrical failures, since a single switchboard can stop several units at once. On the calibrated model, we check that the remaining air conditioners hold the load without any rack leaving the allowable range, identify the most exposed rows and concretely validate the stated redundancy (N+1, 2N) rather than assuming it.

Upgrade projects

Densification, arrival of high-power AI or HPC racks, switch to containment, raising of setpoints to improve the PUE: each variant is tested virtually on the calibrated model. Trade-offs are made on compared temperature maps, not on rule-of-thumb figures. An upgrade campaign does not stop at the IT room, moreover: the additional load feeds through to the UPS, the LV switchboards and the batteries, whose cooling comes under the thermal study of the technical premises. The same model finally allows the works to be sequenced: which racks to move first, which units to stop during the migration, and in which order, without ever leaving the allowable range.

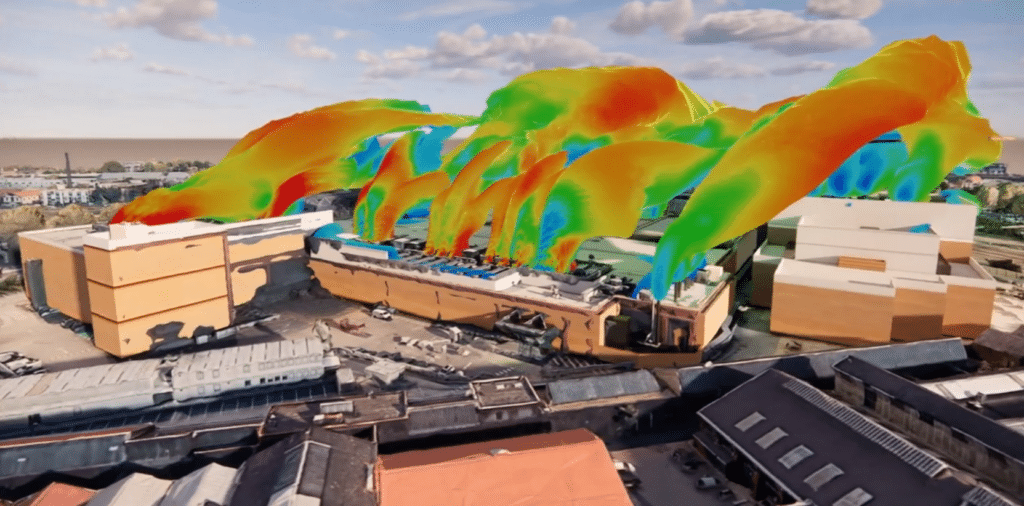
The internal study finally ties in with the external CFD simulation of the data center: recycling of hot-air plumes on the roof and power losses of the dry coolers in extreme conditions directly condition the cooling capacity available in the room. The standards even impose it explicitly: the internal cases are simulated under the worst scenario of the external CFD, incorporating the resulting derating of the cooling-production equipment.

Internal CFD study — data center
06 — Transient

Power cut: the minutes that count

The most critical scenario is handled in transient regime: what happens during a power cut on the site? The calculation follows the temperature rise minute by minute and quantifies the time available before reaching the servers’ critical thresholds. It accounts for the inertia of the chilled-water loop, the switchover sequence to UPS then generators and the restart of the backup equipment, pinpointing the most unfavourable servers. This objective delay becomes the key input for the operating procedures and the sizing of the backup systems.

Typical sequence · power-cut transient
T0Mains cut

The supply collapses, the room lives on its inertia: slab, rack frames, chilled-water volume.

Steady state broken
SwitchoverFailure at start-up

The worst case is retained: one generator refuses to start, the load switches to the next generator following the site sequence.

Single failure
RestartCooling returns

Restart of the chillers, ramp-up of the pumps and fans: timings taken from the manufacturer tests, not from the catalogue.

Measured ramp-up
StabilisationReturn to nominal

The calculation continues until equilibrium is restored, recharging of the thermal-inertia buffers included.

Equilibrium checked
T0 · the room lives on its inertiaTemperature peak before cooling returns

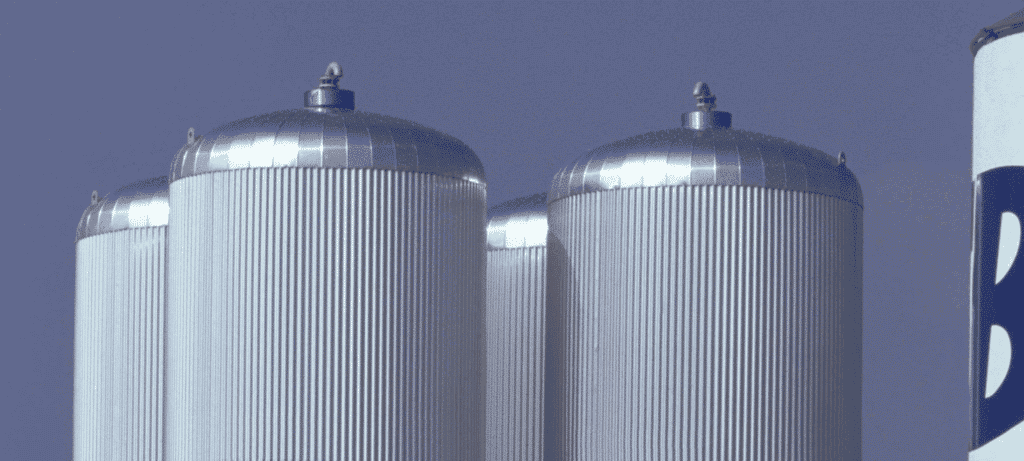
Nothing here is a flat rate. Each source of thermal inertia is justified: chilled-water loop volume, storage buffers, mass of the slab and the racks. The restart times of the chillers and generators come from the factory acceptance tests (FAT) when they have taken place; failing that, the simulation is re-run as soon as the tests deliver the real timings. And when the site has a continuous backed-up cooling, the transient study then serves to size its inertia rather than to demonstrate its necessity. These cooling reserves are themselves the subject of full CFD studies: the stratification of the thermal-storage tanks conditions the energy actually available at the moment of the cut, and the hydraulic behaviour of the chilled-water loop and its networks sets the speed at which this cooling reaches the rooms.

The transient verdict
A few minutesthe verdict plays out in minutes: time available before the critical thresholds, cumulative time tolerated above the alarm threshold, time to return to nominal.

“How many minutes does your room hold without cooling? The answer is computed, it is not guessed.”

Objectified inertiaeach source accounted for and justified: slab, frames, water loop, thermal buffers
Real sequencegenerator start attempts and switchovers simulated according to the site operating sequence
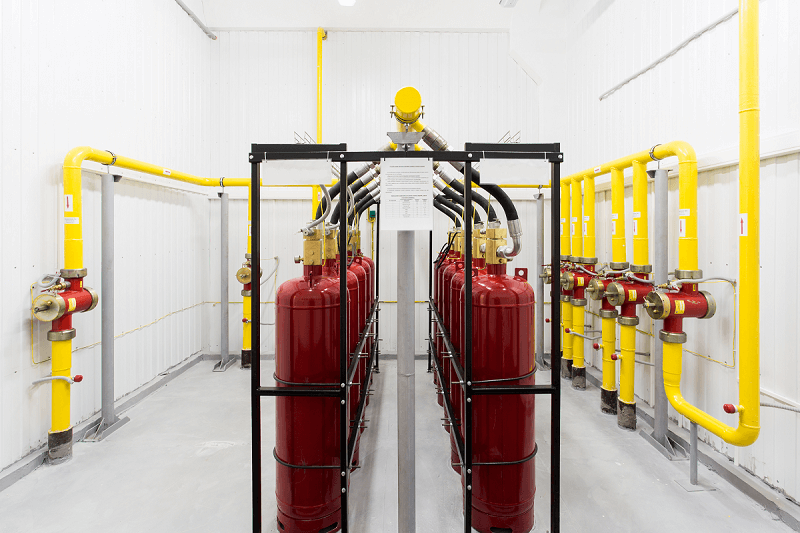
Sprinkler marginhot-aisle temperature compared with the trigger threshold of the extinguishing heads

An often-forgotten criterion completes the analysis: the temperature reached in the hot aisle is compared with the trigger threshold of the sprinkler heads, to check that an electrical cut cannot degenerate into an untimely release of the fire extinguishing above the racks.

07 — Containment & DLC

Containment, high density and liquid cooling

Physical aisle containment is the most structuring lever for separating the flows. The choice of configuration depends on the room, its height, its air-return mode and its operating constraints: CFD makes it possible to compare the options on your real geometry.

Comparison of airflow management strategies in a server room: separation efficiency and constraints.
StrategyFlow separationInvestmentConstraintsTypical case
Alternating aisles without containmentLimitedMinimalRecirculation at the top of the rackLow-density rooms, existing
Cold-aisle containmentGoodModerateContained volume to secure (fire)Raised floor with tile supply
Hot-aisle containmentVery goodModerate to highHigh temperature in the contained aisleFalse-ceiling return, new rooms: the hyperscale-standard default
Close-coupled cooling (InRow)ExcellentHighChilled-water network in the roomHigh-density zones, AI / HPC

In every case, the real efficiency depends on the leaks: missing panels, cable passages, empty racks. The simulation takes them into account and avoids overestimating the gain of a theoretically perfect containment.

Containment is also a financial lever: it can qualify for energy-saving certificates under the scheme dedicated to aisle containment in computer rooms. A documented CFD study, with quantified before/after gains, is a solid piece of evidence to support the application.

Accommodating high density and DLC in an existing room

Integrating high-density or liquid-cooled racks (DLC, Direct Liquid Cooling) disrupts existing rooms and calls for a two-step approach. First a capacity assessment: the simulation projects the resources actually available (electrical power, cooling production, flow rates); it does not invent them. Then the physical constraints the calculation does not address directly: floor load capacity, circulation zones, maintenance operations and machine turnover. These preliminary checks condition the value of the study.

Then comes the “mix cooling” trade-off: making air cooling, DLC and cold doors coexist in the same room. CFD compares the possible distributions and reveals the unsuspected effects: vortices and local depressions, heat dissipation of the busbar trunking, pressure losses of the hydraulic networks.

Hybrid rooms: air and liquid coexist

Liquid cooling does not remove the airflow, it reconfigures it. Part of the heat is still rejected to the air: peripheral electronics of the DLC racks, power supplies, CDU heat exchangers, and the classic racks the standards require to be interleaved between the liquid positions. The specifications therefore require a minimum airflow to be maintained, a fraction of the nominal flow defined by the standard: CFD checks that this residual flow, delivered by fewer units, still reaches every rack that remains air-cooled.

The model incorporates the CDUs, the hydraulic networks running in the hot aisle above the racks with their per-branch load limits, the air-cooling units deactivated to free up space, and the resulting clutter in the plenum. The air/liquid distribution of each row is arbitrated on temperature maps, position by position, including for the future deployments the room will have to absorb.

Learn more: electronic cooling (DLC, immersion)
08 — EOLIOS

The EOLIOS method

EOLIOS is a consultancy of engineers specialised in the climatic design of data centers. For us, internal CFD is not a visualisation exercise: it is a design tool, grounded in a daily practice of IT rooms.

Our teams design and make server rooms reliable for hyperscale, colocation and enterprise infrastructure players, in France and internationally. We work across the whole life cycle: climatic sizing from the sketch stage, aisle layout, redundancy validation in an extreme scenario, commissioning with load banks, then operational support through the digital twin. This dual culture, design and operation, lets us translate every simulation into realistic action plans, compatible with operational practices and service continuity. Investors, integrators and operators rely on our studies to arbitrate their climatic architecture choices and document their availability commitments.

Because the tool is not everything: without an operator’s reading, a simulation remains an image. Every study leads to concrete, directly applicable recommendations (control strategies, degraded modes, monitoring indicators), prioritised according to two constant priorities: service continuity and energy efficiency.

Our studies natively meet the CFD specifications of hyperscale and colocation operators: imposed cascade of cases, CAT/SIT criteria, minimum report contents, deliverables in English when the standard requires it. And because a project cannot wait: our dedicated computing power lets us run urgent simulations, with first results in a few days when the client need demands it.

Compliant with the hyperscalers’ CFD standards

  • Imposed cascade of cases: average density all units, worst case N sought, high density at the worst positions, mix of densities, transient, liquid cooling.
  • Temperature, velocity and pressure maps at 1 m and 2 m above the floor, above the false ceiling and in section in front of the most unfavourable aisle, with minimum, maximum and average.
  • Flow rates and temperatures restored grille by grille, datasheets of the tiles and diffusers appended to the report.
  • SIT summary table by bins and by case, schedule of the cooling units in normal and degraded mode.

The results take the form of 3D images and animations understandable by all the project stakeholders, from investor to operator, usable both in meetings and in technical reports. When confidentiality requires it, the models can only be read through a dedicated viewer supplied by EOLIOS.

How a study unfolds

  • Audit and collection. Drawings, inventory of racks and powers, HVAC setpoints; on existing sites, in-situ measurements and smoke tests.
  • 3D modelling. Room, plenum, equipment and containment, with a mesh suited to the sensitive zones.
  • Calibration. The model reproduces the measured state before any extrapolation.
  • Scenarios. Nominal, transient failures, layout and densification variants.

What we deliver

  • 3D maps of temperature, velocity and pressure, rack by rack.
  • ASHRAE compliance table of the inlet air temperatures, with a SIT-by-bins table case by case.
  • Quantification of bypass and recirculation, prioritised action plan.
  • Grille-by-grille restitution of the supply flow rates and temperatures.
  • Temperature-rise curves per failure scenario and available times.
Learn more: what is CFD simulation?
Our references
+ 0data centers studied
0 yearsof CFD simulation expertise
0of IT rooms simulated
0 countrieswhere we have worked
They trust us
FAQ

Frequently asked questions

What operators and owners most often ask us about internal CFD of a server room.

Do you have to shut the room down for the study?

No. The study runs on a numerical model, with no service interruption. The only on-site work is a non-intrusive measurement campaign (temperatures, flows, thermography), carried out with the room running.

Do you start from plans or on-site measurements?

Both. On a new project the model starts from plans and equipment datasheets. On an existing room it is calibrated on real measurements : it first reproduces the observed state before serving as a reliable test bench.

What is the SIT, and how does it differ from the cold-aisle temperature?

The SIT (Server Inlet Temperature) is the temperature of the air that enters each server, at its front face. The CAT (Cold Aisle Temperature) is measured at the centre of the cold aisle, at the height of the supervision sensors. A room can be compliant on CAT and non-compliant on SIT at the top of the rack : this is why the standards judge the room server by server.

How long does an internal CFD study take?

Two to four weeks depending on room size, the number of scenarios and data availability. An existing room to audit and calibrate takes longer than a design case from plans. In an emergency, our dedicated computing power delivers first results in a few days.

Does CFD replace temperature probes?

No, it complements them. Probes measure a few points at one instant ; the simulation returns the temperature, velocity and pressure fields everywhere and tests scenarios you cannot trigger in production, such as a power cut.

Above what density does the study become essential?

As soon as per-rack power leaves the standards (beyond 8 to 10 kW), when containment is at stake or high-density AI/HPC racks are introduced. Below that, it still helps validate a redundancy or objectify a persistent hot spot.

Do your studies meet the hyperscalers’ CFD standards?

Yes, natively. Imposed cascade of cases (average density, worst case N, high density at the worst positions, mix of densities), CAT/SIT criteria, power-cut transient with a generator failure at start-up, grille-by-grille restitution and SIT-by-bins tables : our reports follow these specifications, in French as in English. Our white paper on using CFD for data centers details the approach.

Media library · Data Center

The climate of a server room.

Digital twin, hot spots, recirculation: CFD makes the thermal behaviour of your data centers visible.

The whole media library
Internal CFD study — data centerInternal CFD simulation
Use cases · Sectors

Where does our “internal CFD” expertise come in?

As soon as a server room combines high density, redundancy and availability requirements, internal CFD secures the design and operation. Here are the typical contexts.

Explore the field

Data Center: continue exploring.

CFD expertise, delivered projects and technical dossiers: the whole Data Center field in one place.

CFDExpert engineers
20+Countries
R&DResearch & innovation
Have a project?

The simplest way is to talk it through together.

A server room to design, make reliable or densify? Our engineers reply with an initial technical read.