
White paper contents21 chapters + 3 appendices
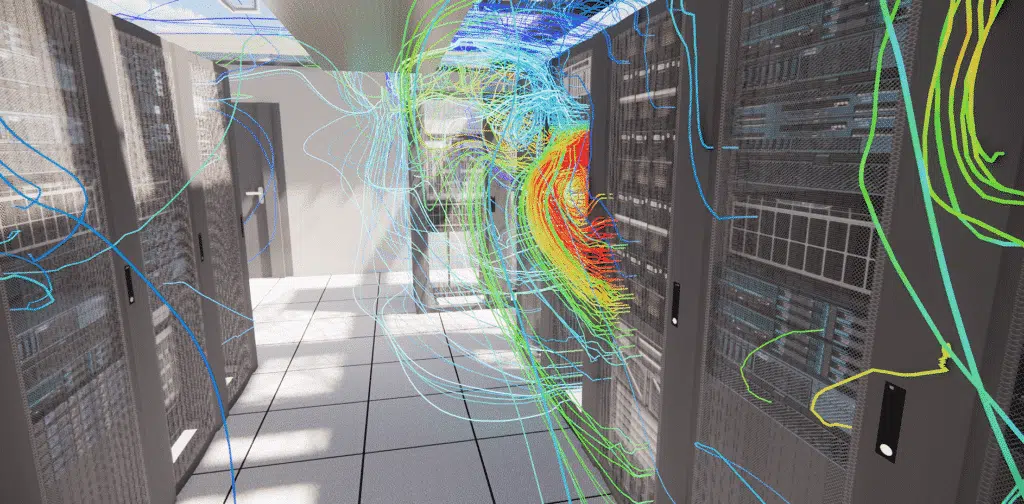
CFD simulation reconstructs the air flows and temperatures of a data center rack by rack. It serves three purposes: proving that a design holds its intake temperatures, diagnosing existing hot spots, and testing failure scenarios with no operational risk. Its value does not come from the software, but from the scope selected, the boundary conditions and the validation against measurements.
- Who uses it? Operators, owners and design offices, in design as well as in operation.
- When? Before works to validate, after an incident to understand, before densification to decide.
- What proof? Intake temperatures, RCI, RTI and Capture Index, under nominal duty and degraded scenarios.
Ten points to bear in mind before launching a study
This white paper addresses two readers. The decision-maker will find the essentials here in three minutes. The engineer will find, in the 21 chapters that follow, the physics, the assumptions, the metrics and the protocols: including what CFD cannot do.
- 01The thermal margin for error has collapsedDensity per rack has changed scale; sizing methods have not.
- 02Cooling capacity is almost never the shortageA data hall overheats through poor distribution of the available cooling, not through a lack of capacity.
- 03Two pathologies dominate all the othersHot air recirculation and cold air bypass: two airflow problems.
- 04Overcooling masks the symptomA low setpoint degrades PUE all year round without removing the risk.
- 05A room can be scored objectivelyRCI, RTI and Capture Index put figures on a before / after, beyond debate.
- 06CFD tests what operation cannot afford to testChiller loss, power cut, heatwave, fire: with no risk and no production stoppage.
- 07An unvalidated CFD is only a hypothesisMesh independence, residuals, closed balances, comparison with measurements.
- 08The envelope counts as much as the roomPlume recirculation on the roof feeds straight back into the chilled water temperature.
- 09Fire changes the criterionThe target is no longer comfort but tenability for evacuation and intervention.
- 10Value is measured in decisions, not in imagesIT capacity released, setpoint degrees recovered, risks removed.
Context, physics of the problem and standards
What has changed in the rooms, what the standards say, and the engineering vocabulary needed to describe a pathology without ambiguity.
The thermal equation of digital: what has really changed
Almost all the electricity entering a data center leaves it as heat. The subject is therefore not "producing cold", but removing a thermal power that is increasingly concentrated in a volume which, for its part, has not grown.
Demand for digital infrastructure has changed order of magnitude. According to the International Energy Agency, data centers consumed around 415 TWh in 2024, close to 1.5 % of global electricity consumption, growing by about 12 % per year since 2017; the base case takes them to 945 TWh in 2030, a doubling in six years. That growth does not only mean more buildings: it means more watts per square metre of floor.
At 5 kW per rack, the volume of the room forgives approximations. At 40 kW, it forgives nothing: the same distribution error no longer costs one degree, but five.
Chapter 01 · the density effectThis is where the engineering break lies. A room designed around 5 kW per rack tolerates many approximations: the air volume of the room acts as a buffer, distribution errors are diluted, and a cooling failure leaves several tens of minutes of margin. At 15, 30 or 60 kW per rack, the same 10 % distribution error no longer produces one degree of deviation but five, the slightest hot air leak becomes a hot spot, and the time available before manufacturer thresholds are exceeded is counted in minutes, sometimes tens of seconds.
Field surveys confirm that the installed base is moving more slowly than the announcements: the Uptime Institute observes a continuous but slow rise in average densities, with growing adoption of the 10–30 kW range, one site in eight reporting racks between 30 and 59 kW, and a few cabinets beyond 100 kW still exceptional. This heterogeneity is precisely the problem: most operators today have to insert high-density islands into rooms designed for low, homogeneous density. It is the most frequent use case for CFD.
The global PUE has stopped moving
The Uptime Institute measures an average PUE stuck around 1.54 for six consecutive years, while hyperscalers announce 1.10 to 1.15. The gap does not come from a technological secret: it comes from the quality of air distribution and from the ability to work with high setpoints in complete safety. That is exactly the playing field of simulation.
Concrete consequences of poorly controlled thermals
- Permanent operating overcost Preventive overcooling is paid for every hour of the year, in cooling production and fan energy.
- Accelerated ageing Thermal cycles and high intake temperatures degrade electronics, fans and batteries.
- Shutdown risk Beyond the thresholds, servers reduce their frequency (throttling) then stop: often several racks at once, because they share the same airflow defect.
- Frozen capacity For want of thermal proof, physically available positions remain off limits to load. That is a direct loss of revenue.
Classic methods, such as the global power balance, the "total airflow is sufficient" rule or the per-room load spreadsheet, answer a question of quantity. They never answer the question of location: where does the cold air actually arrive, at what temperature does it enter that specific rack, and what becomes of that distribution when one unit stops. Only a spatially resolved solution of the flows answers those three questions.
From silicon to the atmosphere: the five scales of the thermal chain
A frequent mistake is to treat the data center as a single object. In reality, the heat crosses five successive thermal barriers, each with its own physics, its own resistances and its own failure modes. A CFD study only makes sense if you know at which scale the question sits.
The five successive thermal barriers, from the millimetre to the site: at each scale, one dominant physics, one critical quantity and one specific failure mode.
The scales are not independent: they propagate. Plume recirculation on the roof (scale 5) raises the air temperature at the dry cooler intakes, therefore the chilled water temperature, therefore the supply temperature in the room (scale 3), therefore the rack intake temperature (scale 2) and finally the junction temperature of the processors (scale 1). A defect at scale 5 is read at scale 1: and conversely, densification at scale 1 ends up visible on the roof.
This reading by scales also dictates the modeling scope. Simulating a whole room with heat sink detail would be absurd: the rack is represented by an equivalent model (airflow, ΔT, pressure drops). Conversely, studying an internal hot spot while modeling only the roof makes no sense. The right reflex is to choose the coarsest scale that still contains the cause of the problem, then go down one level if necessary.
Thermal study of technical rooms (UPS, switchgear)The European regulatory framework: ASHRAE, EN 50600, Uptime, F-Gas
A thermal study only has value when related to an enforceable criterion. Without a reference framework, a temperature map is an aesthetic object; with one, it becomes proof of compliance or a record of deviation. Here are the texts that structure the practice.
Classes A1 to A4. Defines the temperature and humidity envelope at the equipment intake, recommended range and allowable ranges.
Thermal compliance criterionEuropean facility standard. Covers design, construction and operation, including availability classification and energy efficiency.
European regulatory frameworkTopology and maintainability, not temperature. It does determine which degraded scenarios the study must demonstrate.
Defines the scenarios to simulateASHRAE TC 9.9: the reference for intake conditions
The Thermal Guidelines for Data Processing Environments from ASHRAE technical committee 9.9 define, for the air entering the equipment (and not for room air), a recommended range and allowable ranges per equipment class. The usual recommended range is 18 to 27 °C, with an upper relative humidity limit and a dew point envelope. The allowable ranges then extend by class: about 15–32 °C (A1), 10–35 °C (A2), 5–40 °C (A3) and 5–45 °C (A4). The committee has moreover extended its recommendations to liquid-cooled equipment to cover densities above 40 kW per rack, acknowledging that the historical air-centred framework was no longer sufficient.
The practical consequence of this framework is fundamental for simulation: the success criterion never bears on a room average, but on the air temperature at the intake of each rack, at every point of the usable height. A room averaging 22 °C can perfectly well show intakes at 34 °C at the top of a rack: that is a non-compliance, invisible in a global balance.
Editions and exact values evolve: for a project, always refer to the edition in force and to the manufacturer specifications of the installed equipment, which may be more restrictive.
EN 50600: the European facility standard
The EN 50600 series covers the design, construction and operation of data centre facilities and infrastructures: availability classes, physical protection, power distribution, environmental control and efficiency indicators (including PUE, also standardised at ISO/IEC level). It provides the contractual vocabulary that matters when a study has to prove a level of service, and not only thermal comfort.
Uptime Institute: the redundancy Tiers
The Tier I to Tier IV classification does not speak of temperature but of topology and maintainability. It concerns CFD directly because it defines the configurations to be proven: if the facility claims concurrent maintainability, then thermal behaviour must remain acceptable during the deliberate unavailability of a component. That is not demonstrated at nominal duty, but in a degraded scenario (chapter 14).
Environmental and safety framework: the European scale, the national variants
The structuring requirements are today European; it is their national transpositions that vary from one country to another. The same project run in France, Germany, the Netherlands or Ireland answers the same physical objectives, but before different authorities and permitting procedures.
- F-Gas Regulation (EU) The progressive phase-down of high global warming potential refrigerants steers refrigeration architecture choices and pushes towards free cooling, therefore higher setpoints, therefore a heightened requirement on air distribution.
- Energy Efficiency Directive (EU) Data centres above a given installed power threshold report their performance indicators, including PUE and heat reuse. Thermal proof becomes an argument in the file, not just operational comfort.
- Environmental permitting Generator sets and fuel storage, refrigerants, cooling towers: depending on capacities and quantities, the site falls under a permitting or notification regime, with requirements on exhaust dispersion and health risk control. The ICPE nomenclature in France, the BImSchG regime in Germany or the Dutch environmental permit all pursue the same objective: demonstrating dispersion.
- Cooling towers & legionella When wet cooling is selected, legionella risk control requires a risk analysis and a demonstration of plume dispersion, whatever the jurisdiction.
- Fire safety The classification of the building determines the applicable framework and the smoke control objectives: national regulation of the host country, complemented in practice by the Eurocodes for the structure and by insurer standards (VdS, FM, CNPP) depending on the client. Automatic gas extinguishing has its own design rules (chapter 16).
The eight airflow pathologies of a data hall
In the field, thermal disorders almost always come down to a small number of recurring mechanisms. Naming them precisely is the first step of the diagnosis: each has a measurable signature and a distinct remedy. Confusing them leads to treating a symptom with the wrong lever: the textbook case being added cooling capacity to compensate for a sealing defect.
1 · Recirculation
Hot air rejected by the servers returns to the cold aisle and raises the intake temperature, generally at the top of the rack. Signature: strong vertical intake gradient, low machine ΔT.
- Causes: missing blanking panels, unconfined aisle, insufficient airflow.
2 · Bypass
Cold air returns to the air handling unit without passing through any server. It cools nothing, but consumes fan energy and crushes the return ΔT.
- Causes: badly placed perforated tiles, unbrushed cable openings, plenum leaks.
3 · Localised hot spot
Zone where the intake exceeds the threshold while the room is globally cold. It is a distribution problem, never a capacity one.
- Causes: dense island inserted, obstacle in the plenum, undersized grille.
4 · Plenum imbalance
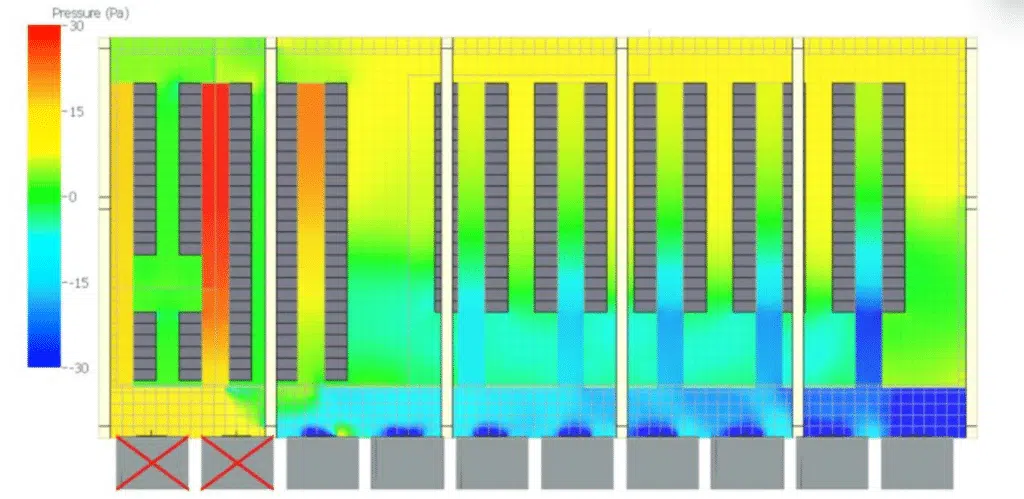
Under a raised floor, pressure is not uniform: some tiles supply air, others draw it in. A tile under negative pressure is a thermal short circuit.
- Causes: insufficient height, cable trays, jet effect of the CRAC units.
5 · Stratification
In tall rooms or with low mixing, hot air accumulates under the ceiling and comes back down at the end of the aisle. The effect is amplified by buoyancy at high densities.
- Causes: badly positioned high returns, global airflow too low.
6 · Overcooling
The most common answer to the five previous pathologies: lower the setpoint. The hot spot recedes by a few degrees, the energy bill rises permanently.
- Signature: low setpoint, low ΔT, degraded PUE, persistent hot spots.
7 · Interaction between units
Two neighbouring CRAH units fight over the return or blow against each other; the total airflow is met, the distribution is poor. Frequent after an extension.
- Causes: unstudied layout, independent control loops.
8 · Containment discontinuity
A breached containment (open door, missing panel, removed rack) loses much of its benefit. Airflow is very sensitive to small openings.
- Causes: operations, works, empty positions left unblanked.
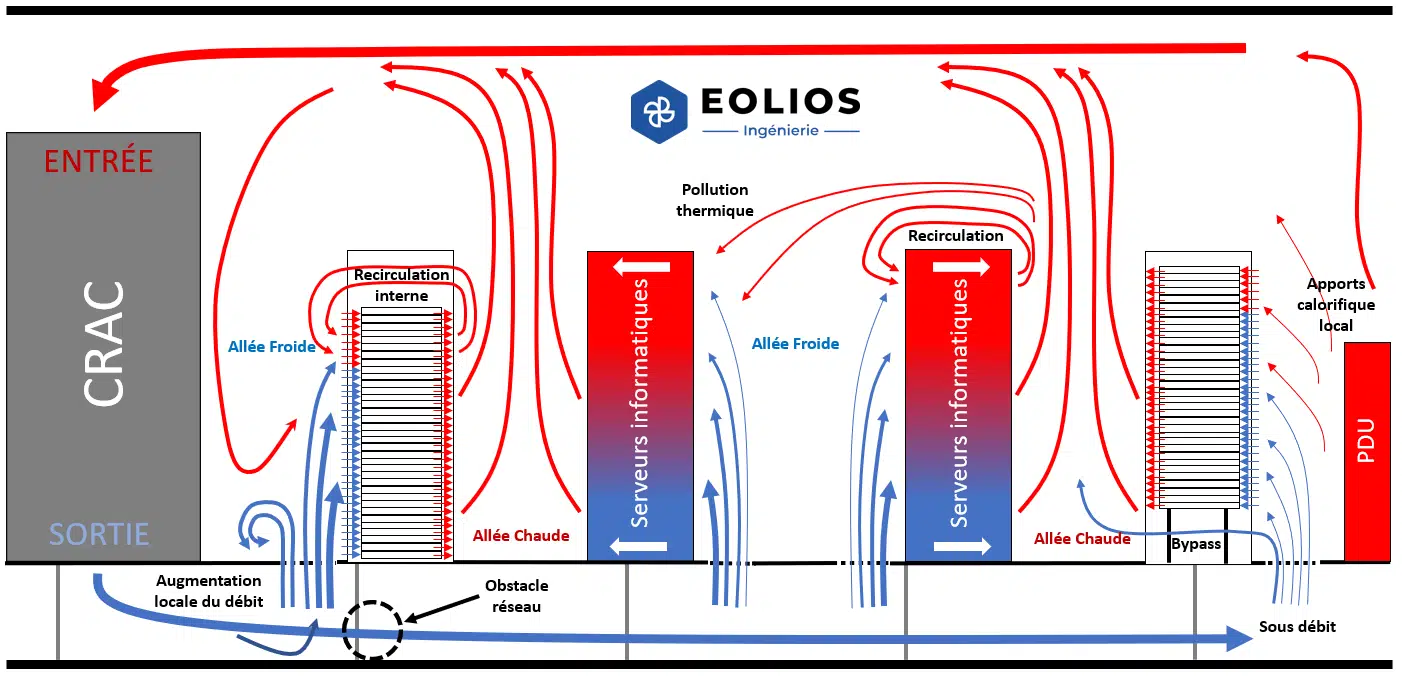
These eight mechanisms combine, and that is what makes diagnosis difficult without simulation: the same temperature measured at the top of a rack may result from recirculation, from a bypass that has emptied the plenum, or from an interaction between two units ten metres away. The probes say that there is a problem; the computed field says where the air goes, therefore which remedy will work.
Engineering metrics: scoring a room objectively
To compare a before and an after, or two design variants, you need indicators that condense a three-dimensional field into a few numbers that can be discussed in a meeting. The industry has standardised a small set of them, all built on the same principle: comparing real thermals with ideal thermals.
| Indicator | What it measures | Reading | Usual target |
|---|---|---|---|
| RCIHI / RCILO Rack Cooling Index | Share of intakes within the recommended ranges, weighted by the extent of the exceedances (high and low) | 100 % = no rack outside the recommended range | > 96 % |
| RTI Return Temperature Index | Ratio of the ΔT seen by the air handling units to the ΔT seen by the IT equipment | < 100 % → bypass ; > 100 % → recirculation | ≈ 100 % |
| SHI / RHI Supply / Return Heat Index | Fraction of heat picked up by the cold air before it reaches the servers | Low SHI = little parasitic mixing | SHI < 0.2 |
| Capture Index (cold aisle) | Fraction of the air drawn in by a rack that actually comes from the tiles or the containment | Local indicator, rack by rack | > 90 % |
| Capture Index (hot aisle) | Fraction of the air rejected by a rack that is actually captured by the returns | The remainder goes into recirculation | > 90 % |
| Rack ΔT | Server inlet/outlet difference, a direct image of the airflow passing through | Low ΔT = too much air or internal bypass | 10 to 20 K |
| Airflow ratio | Airflow delivered by the distribution / airflow demanded by the servers | < 1 → recirculation guaranteed | 1.05 to 1.15 |
The value of these indicators is twofold. In diagnosis, they point immediately to the right family of remedies: an RTI of 70 % with correct intakes signals excess airflow and bypass, therefore a saving potential, not a risk. In design, they make it possible to set performance commitments verifiable in the model, then at handover.
Airflow, the only truly sizing variable
Everything starts from an elementary enthalpy balance. The power removed by an air stream is written:
In practical form: V̇ [m³/h] ≈ 3,100 × P [kW] / ΔT [K], i.e. about 260 m³/h per kW for a ΔT of 12 K.
This relation explains most of the trade-offs of the trade. Increasing the ΔT proportionally reduces the airflow, therefore the fan energy (which varies roughly with the cube of the airflow): it is the most powerful saving lever. But a high ΔT means hotter return air, therefore far heavier consequences in the event of recirculation. Containment is not a comfort option: it is what makes a high ΔT usable without risk.
Containment is not a comfort option. It is the condition that makes a high ΔT, and therefore the energy saving, usable without taking a risk.
Chapter 05 · airflow, ΔT and fan energyWorking out an order of magnitude
The tool below applies this relation, then derives from it the second figure every operator should know: the rate of temperature rise of the room in the event of total loss of cooling, obtained by dividing the dissipated power by the thermal capacity of the air volume.
Reading: the computed drift is deliberately conservative: the thermal mass of the building, of the racks and of the servers typically slows the rise by 20 to 40 %, whereas unfavourable stratification can on the contrary exceed thresholds locally well before the average. This order of magnitude does not replace a transient simulation (chapter 14), which alone gives the real evolution, rack by rack.
Overview of cooling technologies: from air to immersion
The choice of a cooling architecture is driven first by density per rack, then by site constraints (clear height, available water, climate, regulation) and finally by operations. CFD comes in at every level, but with different questions: in air, we look for where the air goes; in liquid, we look for what is left for the air to do, because part of the heat continues to be dissipated in the room.
| Architecture | Usual density | Principle | CFD point of attention |
|---|---|---|---|
| Air, open room raised floor + perimeter CRAC/CRAH | ≤ 5–8 kW | Pressurised plenum, perforated tiles, free return | Plenum pressure uniformity, bypass, aisle length |
| Air + aisle containment cold or hot | 8–20 kW | Physical separation of flows; high usable ΔT | Sealing, blanking panels, doors, airflow ratio > 1 |
| In-row / in-rack | 15–35 kW | Heat exchanger as close as possible to the load, short loop | Interaction between modules, control, local redundancy |
| Active rear door rear-door heat exchanger | 20–40 kW | Capture at the rack outlet: the room stays neutral | Residual room airflow, backup in the event of water loss |
| Direct liquid cooling (DLC) cold plates | 40–120 kW+ | The fluid captures 70 to 90 % of the heat at the component | Residual fraction dissipated to air, CDU, local hot spots |
| Dielectric immersion | 50–200 kW | Immersed servers, single or two-phase | Tank thermals, operation, fire and detection |
Going liquid does not remove the air study
A rack under direct liquid cooling still rejects 10 to 30 % of its power into the room air: power supplies, memory, network, losses. On a 100 kW rack, that represents 10 to 30 kW of air to be handled, i.e. the density of a whole rack of the previous generation. Hybrid architectures are therefore the ones where CFD remains most useful, because nobody has any intuition about the residual thermals of a mixed room.
Liquid cooling is progressing fast wherever accelerator loads demand it: some recent computing architectures reach cabinet powers of the order of 120 kW, out of reach of air cooling at full load. The installed base, however, remains overwhelmingly air cooled: the real challenge of the decade is less "air or liquid" than the coexistence of both in the same rooms, with different temperature ranges and different redundancies.
Cooling systems for data centers Electronics cooling: from the component to the cold plateThe physics and the simulation method
What a solver actually solves, which physical models are legitimate in a data hall, and under what conditions a result deserves to be believed.
What a CFD simulation actually computes
CFD (Computational Fluid Dynamics) numerically solves the conservation equations of fluid mechanics over a domain divided into elementary volumes. It "predicts" nothing: it computes the consequences of the assumptions it is given. That is why the quality of a study rests first on the input data and on the choice of models.
The equations solved
In a data hall, air is treated as a weakly compressible Newtonian fluid. Three families of equations are solved simultaneously on each control volume: conservation of mass (continuity), conservation of momentum (Navier-Stokes, including the buoyancy term) and conservation of energy (enthalpy transport, with conduction and possibly radiation). To these are added, depending on the case, transport equations for turbulence, humidity, chemical species (smoke, extinguishing gas) or particles.
The solution is iterative: starting from an initial field, the solver corrects pressure and velocities until the local imbalances (the residuals) become negligible. A distinction is made between steady-state computations (seeking the equilibrium state, the nominal duty case) and transient ones (following the evolution in time), the latter being indispensable for a failure or a fire.
What CFD brings that no other method brings
The complete field
- Temperature, velocity, pressure and age of air at every point, including where no probe could ever be placed.
- Trajectories and stream tubes: you see where the air comes from before it enters a given rack.
Extreme scenarios
- Unit loss, power cut, heatwave, fire: testable with no operational risk.
- Comparison of design variants before any commitment to works.
Causality
- Measurements record; computation explains and makes it possible to test a remedy in isolation.
- Basis of a digital twin reusable at every change of load.
Physical modeling: turbulence, buoyancy, porous media, radiation
A data hall is a case of mixed convection: supply jets impose a forced dynamic, while hot plumes impose a natural one. The two compete for the field, and depending on the balance of forces, the same room can behave very differently. The choice of models is therefore not a software detail: it is an engineering act that must be justified in the report.
Turbulence models
Turbulence is not solved directly: that would require meshes out of reach. Averaged equations (RANS) are solved and the effect of turbulence on the mean field is modeled.
| Model | Behaviour | Typical use |
|---|---|---|
| k-ε (standard, realizable) | Robust and economical, but imprecise near walls and on separations; tends to over-diffuse | Large volumes, first iterations, low-density rooms |
| k-ω SST | Good compromise: reliable treatment of the boundary layer and of adverse gradients | Default choice when wall temperatures and jets matter |
| RSM / anisotropic models | More expensive, captures complex recirculations better | Special cases, detailed expertise of one zone |
| LES / hybrid | Resolves large unsteady structures; very high cost | Research, strongly unsteady phenomena, local scale |
Buoyancy: Boussinesq or variable density
At the moderate temperature differences of a data hall (10 to 20 K), the Boussinesq approximation (constant density except in the gravity term) is legitimate and numerically comfortable. It ceases to be so as soon as the differences become large: dry cooler plumes, generator exhausts, and of course fire, where density must be treated as fully variable with temperature. Using Boussinesq on a fire case is a classic modeling error.
This dimensionless number compares the buoyancy forces (temperature difference, characteristic height) with the inertial forces of the supply (air velocity). It says which of the two drivers commands the flow.
Low Ri: the supply imposes its trajectory, the air goes where the designer sends it. High Ri (high density, low airflow, great height): buoyancy takes over and the air rises, whatever the design intent. That is the mechanism behind stratification and behind the majority of recirculations at the top of racks.
Porous media: representing without meshing
It would be absurd to mesh every tile perforation, every server and every grille. They are represented by equivalent porous media, characterised by a pressure drop law (viscous and inertial Darcy-Forchheimer terms) calibrated on manufacturer data or on measurements. This approach applies to perforated tiles (perforation ratio, presence of a damper), to rack faces, to filters and coils and to return grilles. The quality of that calibration directly determines the fidelity of the airflow distribution: it is often there, and not in the turbulence model, that accuracy is lost.
Modeling racks and air handling units
- Racks Imposed-airflow model (the server fan regulates) or imposed-ΔT model (the power is known). The choice changes the behaviour in a degraded scenario: an imposed-airflow model does not "see" the runaway of internal fans when the incoming air heats up.
- CRAC/CRAH Fan characteristic curve rather than fixed airflow, otherwise the redistribution of airflow when one unit stops and the network changes operating point is ignored.
- Leaks Cable openings, floor joints, unblanked positions. A real room leaks; a perfectly sealed model is systematically optimistic.
The software used in the data center world
The landscape splits into two families. On one side the data center dedicated tools, which embed object libraries (racks, CRAH, perforated tiles, containments) and directly compute the sector indicators. On the other the general-purpose solvers, heavier to deploy but with no limit of scope: this is the only possible choice as soon as a roof, a plume, a fire or an off-catalogue geometry has to be handled.
None of these tools decides the scope, the boundary conditions, the turbulence model or the compliance criterion: these are the four choices that make the value of the study, and they come before the solver. Two design offices using the same software can produce results several degrees apart. The question to ask a provider is therefore not "which software do you use?" but "how did you verify and validate this computation?" (chapter 11).
Radiation
Often negligible between racks, radiation becomes important again in three situations: compact technical rooms with high density per square metre (UPS, switchgear), solar gains on the envelope and roof in external studies, and fire, where it is a major transfer mode and governs spread to neighbouring racks.
What is a data center digital twin?Meshing: the discretisation decides what will be seen
Simulation amounts to solving a system of non-linear partial differential equations over a finite number of cells. The mesh is that division. It sets the spatial resolution of the information: a phenomenon smaller than the cell does not exist in the result. On a data hall, that means a coarse mesh will smooth out precisely what is being looked for: intake gradients at the top of racks and local leaks.
Meshing strategy for a data hall
- Hybrid mesh Hexahedra dominant in regular volumes (aisles, plenum), tetrahedra, prisms and pyramids to connect complex geometries. This combines the accuracy of structured meshes with the flexibility of unstructured ones.
- Targeted refinement Rack faces, perforated tiles, supply and return outlets, containment openings, plenum singularities. These are the high-gradient zones.
- Prism layers Near walls, to correctly capture boundary layers and heat exchanges when they matter.
- Geometric quality Skewness, aspect ratio and size jumps between neighbouring cells are monitored. A degenerate cell degrades convergence far beyond its neighbourhood.
Mesh independence, non-negotiable
A result only has value if it no longer depends significantly on mesh fineness. The demonstration is simple and must appear in the report: the same case is solved on at least three meshes of increasing fineness (typically a factor of 1.5 to 2 on the characteristic size) and a few representative output quantities are tracked: maximum intake temperature, RCI, airflow of a critical tile. When the difference between two levels drops below a threshold (often a few tenths of a degree), the mesh is deemed sufficient.
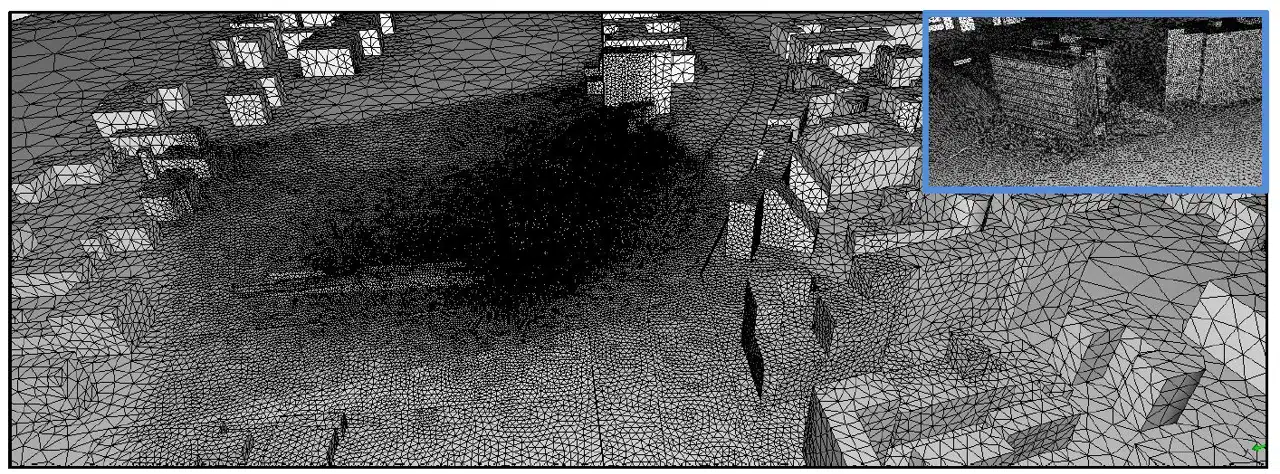
A data hall of common size is routinely modeled with a few million to a few tens of millions of cells depending on the level of detail of the racks and the plenum. Quality does not come from the number of cells, but from their placement: ten million badly distributed cells are worth less than two million well oriented towards the useful gradients.
Boundary conditions: where the reality of the site is injected
Boundary conditions mathematically express the interaction between the computed domain and its environment. They carry most of the physical truth of the site: it is through them that the simulation learns what the installation really does. Formally, either a value is imposed on the boundary (Dirichlet condition: temperature, velocity), or a flux or gradient (Neumann condition: dissipated power, adiabatic wall), or a mixed relation (heat transfer coefficient, fan curve).
| Boundary | Condition applied | Frequent pitfall |
|---|---|---|
| CRAH supply | Airflow-pressure curve, supply temperature, jet direction and diffusion | Fixed airflow and purely normal jet: reality includes a swirl component and a control range |
| Return | Imposed pressure or balanced extracted airflow | Idealised return that "sucks up everything", masking the real recirculation |
| Perforated tiles | Calibrated porous medium + damper if any | Nominal perforation ratio ≠ real permeability with a partly closed damper |
| Racks | Dissipated power + airflow or ΔT, internal pressure drops | Nameplate power instead of the power actually consumed: massive overestimation |
| Walls, ceiling, floor | Adiabatic, isothermal or heat transfer coefficient; solar gains where relevant | Setting everything adiabatic: acceptable in a data hall, wrong in a technical room on a façade |
| Leaks & openings | Equivalent leakage areas, containment doors | Complete omission: the model becomes better performing than the real room |
| Fresh air / outdoors | Temperature, humidity, wind (atmospheric boundary layer profile) | Using an annual average instead of the sizing climatic scenarios |
The choice of climatic scenarios deserves particular attention. An installation is sized on unfavourable situations: high-percentile heatwave (not a monthly average), wind direction penalising for plume recirculation, winter for condensation and free cooling questions. In practice, a reduced set of sizing operating points is retained, each justified by climatic data from the most representative weather station.
The accuracy of a CFD is capped by the worst of its input data
An IT power known to ±30 % makes any debate about the turbulence model illusory. Before refining the computation, you have to refine the inputs: powers actually measured, airflows surveyed, positions recorded. That is the purpose of the site survey (chapter 12).
Convergence, verification, validation, uncertainties
A simulation always produces images. Nothing guarantees that they describe anything. The distinction is structuring: verification asks "are we solving the equations correctly?", validation asks "are we solving the right equations, with the right data?". Both are necessary and neither replaces the other.
Convergence criteria
Stabilised several orders of magnitude below their initial value: a necessary condition, never a sufficient one.
Mass and energy conserved over the domain to within 1 %. A balance that does not close invalidates the computation, even with fine residuals.
The maximum intake temperature and the critical airflows no longer evolve with the iterations.
A real room may be intrinsically unsteady (oscillating plumes); the case must then be run as a transient rather than forcing a false convergence.
Validation: confronting reality
On an existing installation, validation consists in comparing the computation with independent measurements: intake temperatures recorded at several heights, tile airflows, return temperatures, possibly smoke tests to check trajectories qualitatively. The least well known parameters are then adjusted (permeabilities, leaks, real distribution of powers) until an acceptable agreement is reached. That is calibration. It turns a generic model into a digital twin of the site, reusable for all subsequent studies.
On a new-build project, no direct validation is possible: there is nothing to measure. Confidence then rests on three pillars: models validated on analogous cases, explicitly stated conservative assumptions, and a sensitivity analysis on the uncertain parameters. A serious report says which ones, and in which direction they push the result.
Sensitivity analysis and margins
Rather than a single figure, a robust study delivers a range. The doubtful parameters are varied within their credible bounds (IT power ±10 %, plenum leaks, damper opening ratios, outdoor temperature) and the effect on the indicators is observed. This answers the only question that really counts in a project meeting: how much margin do we have before the conclusion changes?
What is actually simulated on a data center
From the site survey to failure scenarios, from the room to the roof, from fire to PUE: the six families of studies we carry out.
The site survey: what is measured before simulating
On an existing installation, the most profitable phase of a study is not the computation: it is the measurement campaign. It sets the upper bound of accuracy for everything that follows, and on its own it reveals part of the disorders.
The minimum data set
- Real powers Readings from PDUs or switchboard feeders, rack by rack where possible. Never nameplate powers, which commonly overestimate by 30 to 100 %.
- Intake temperatures At the bottom, middle and top of the rack, on a representative sample; it is the vertical gradient that signs recirculation, not the average value.
- Supply and return temperatures Of each unit, with the setpoint and the fan load factor.
- Perforated tile airflows With an airflow hood: this is the most revealing measurement of an unbalanced plenum, and the one most often missing from the file.
- Plenum pressure At several points, and the real clear height under the floor.
- As-found geometry Up-to-date drawings, real rack positions, empty locations, blanking panels present or not, cable trays, brush grommets.
- Infrared thermography Quick mapping of rack faces, containment doors and technical rooms; an excellent tool for spotting leaks.
- Smoke test Occasional: direct visualisation of trajectories, unbeatable for convincing and for qualitatively validating the model.
- Instantaneous PUE And BMS history: to size the saving potential and have a point of comparison after action.
The first check to run on a set of measurements is a power balance: the heat removed by the units (airflow × return ΔT) must match, to within a few percent, the electrical power consumed by the IT equipment. When the gap exceeds 15 %, it is not the room that is strange: it is a measurement that is wrong. Detecting that before modeling saves weeks of analysing an artefact.
The most instructive discrepancy of a measurement campaign is almost never thermal: it is a documentary one. Real powers per rack that do not match the file, blanking panels removed during an intervention and never put back, perforated tiles moved over the years without updating the drawing. The model first serves to make those discrepancies visible, before computing anything at all.
Internal CFD of the data hall: what we look at, and in which order
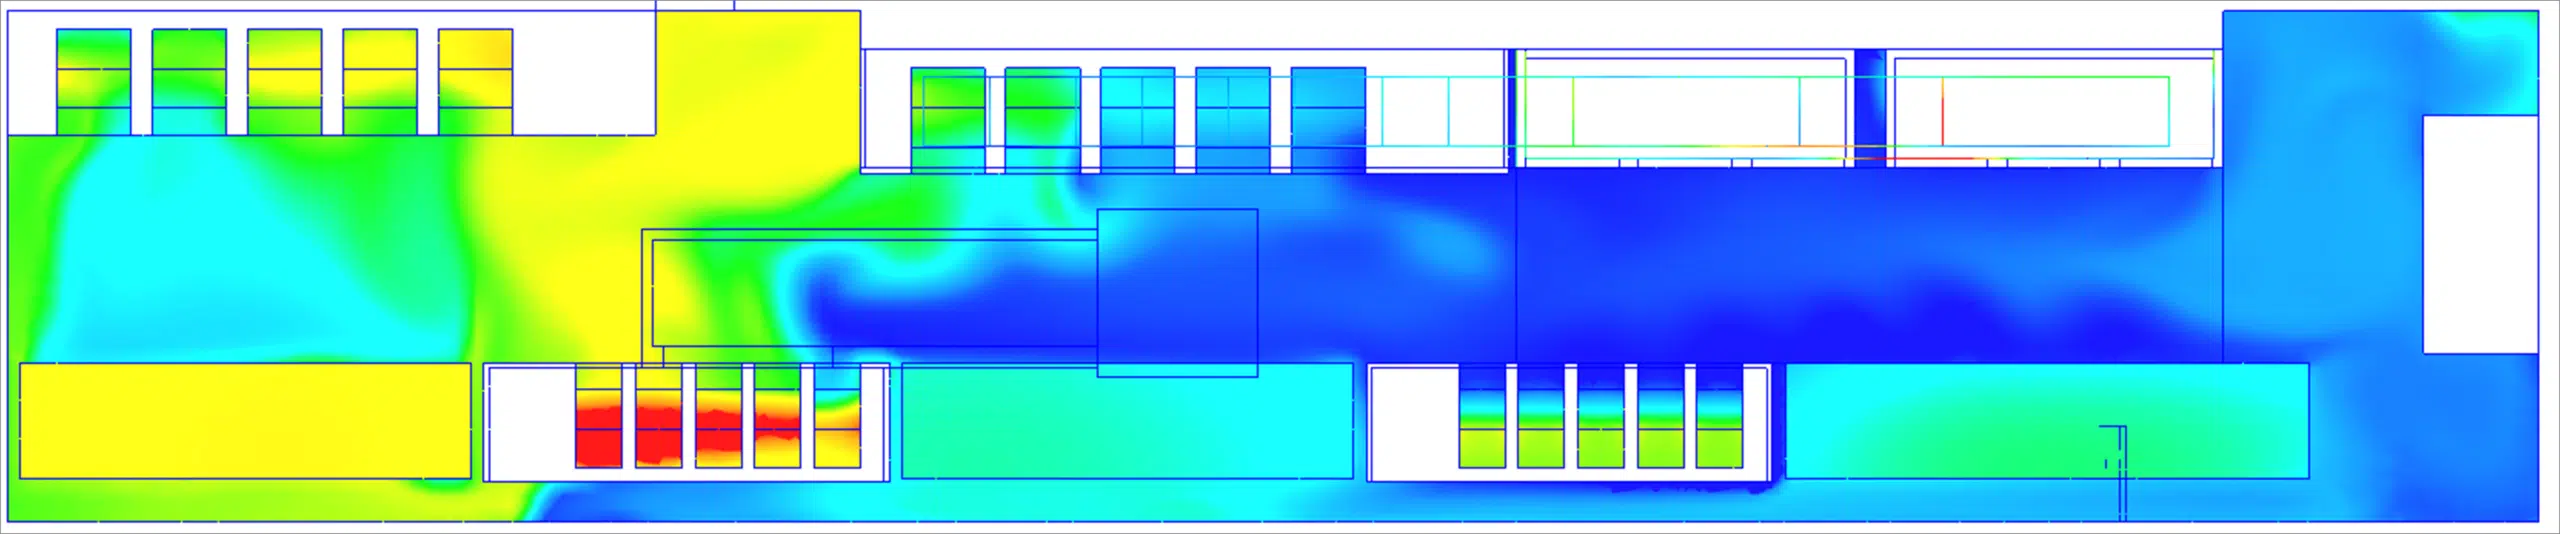
At nominal duty, the objective is not to produce a beautiful map but to answer a finite list of questions, in an order that goes from the global to the local. This sequence is our standard analysis grid.
| # | Question asked | Result used | Associated decision |
|---|---|---|---|
| 1 | Is the total airflow sufficient, and with what margin? | Airflow ratio, RTI | Adjust fan speed, reveal a costly excess |
| 2 | Is the under-floor distribution homogeneous? | Plenum pressure field, tile-by-tile airflow | Move tiles, blank off, clear the plenum |
| 3 | What air temperature actually enters each rack? | Vertical intake profiles, RCI, Capture Index | ASHRAE compliance, placement of dense loads |
| 4 | Where does the air entering the critical racks come from? | Trajectories, age of air, stream tubes | Distinguish recirculation, bypass and plenum defect |
| 5 | Is the containment effective? | Leakage airflows at the interfaces, temperature isovalues | Rework the sealing, blank off empty positions |
| 6 | How far can the setpoint be raised? | Setpoint sweep, margin at the most critical threshold | Direct PUE gain, extension of free cooling |
| 7 | Where should the next dense racks go? | Mapping of residual capacity per location | Layout plan, IT capacity released |
The sixth question is the one that produces the most economic value, and it is the one that cannot be asked without simulation. Raising the supply setpoint by 2 to 3 °C reduces cooling production consumption and considerably extends the annual hours of free cooling: but only if there is proof that no rack leaves its allowable range, including at the top of the worst-placed rack, including when one unit is stopped. CFD provides exactly that proof.
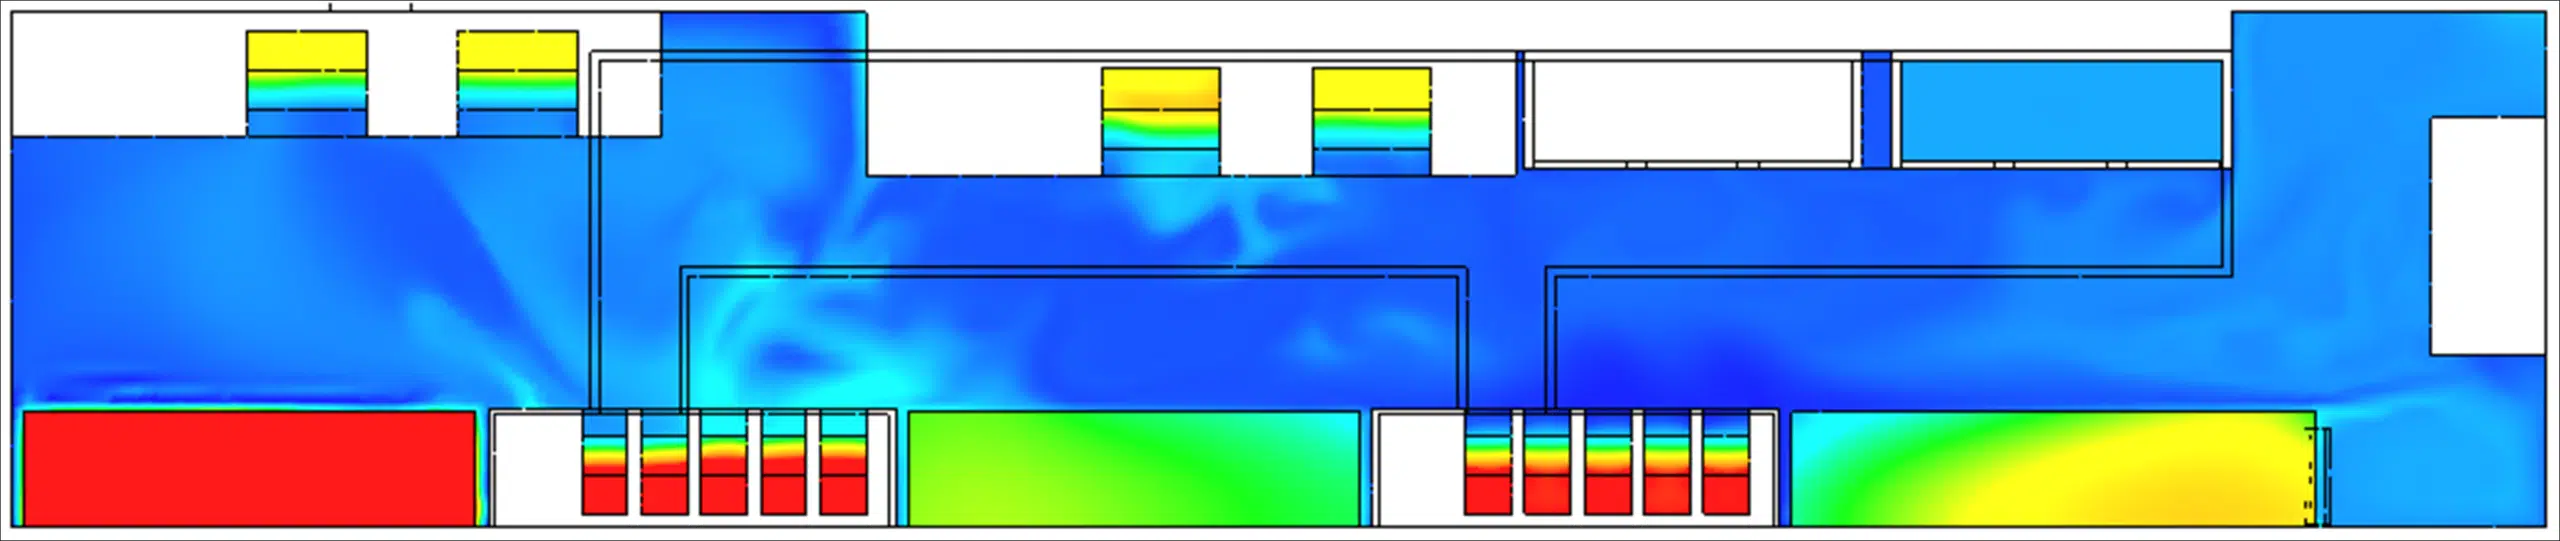
Technical rooms, a classic blind spot
Server rooms concentrate attention; UPS, switchgear and transformer rooms concentrate incidents. They combine high density per square metre, a small volume, often rudimentary ventilation, a share of radiative transfer and strict manufacturer thresholds on batteries. They are excellent candidates for a dedicated study, generally quick and with a high return.
Data center CFD engineering Technical roomsFailure scenarios: the thermals of the first minutes
A well-designed data center is not judged at nominal duty, where almost everything works, but on its ability to get through an incident. This is the field where CFD has no competitor: nobody agrees to shut down a chiller in production to see what happens.
The scenarios to be investigated
- Loss of one air handling unit The total airflow drops, but above all the distribution map changes. Neighbouring units redistribute according to their curve, and the service zone lost is not the one you would expect. Some tiles may reverse.
- N+1 configuration under maintenance Identical to the previous one but deliberate and prolonged; it is the proof required by concurrent maintainability claims.
- Loss of a chiller or of a loop The supply temperature drifts while the airflow remains nominal. The signature is very different from a loss of airflow.
- Power cut and switch to backup For a few seconds to a few tens of seconds, the unit fans stop while the IT equipment, on UPS, keeps dissipating. The plenum depressurises very fast, the room moves into a pure buoyancy regime.
- Prolonged heatwave Cooling production loses efficiency and free cooling is no longer available; the internal study must then be coupled with the external one (chapter 15).
- Containment breach during works Open door, panels removed, rack being replaced. A mundane scenario, rarely investigated, often responsible for alarms.
At 200 kW in a large volume, the operator has time to react. At 800 kW, the automatic fan restart sequence becomes the only safeguard: its response time must be compared with the time to threshold exceedance, rack by rack.
These orders of magnitude are enough to understand why the subject has changed nature with density: at 200 kW in a large volume, the operator has time to react; at 800 kW, the automatic fan restart sequence becomes the only safeguard, and its response time must be compared with the time to threshold exceedance. That is precisely what a transient simulation provides: not an average, but the intake temperature curve of each rack, second by second.
A data center is not judged at nominal duty, where almost everything works. It is judged on the first two minutes of an incident.
Chapter 14 · failure scenariosAn effective containment reduces the buffer volume
Aisle containment is excellent at nominal duty: it removes mixing. But in the event of a loss of cooling, it isolates the load within a reduced air volume: the hot aisle no longer has the inertia of the whole room to damp the rise. The best rooms in operation may therefore be the fastest to drift: a counter-intuitive result that only a transient simulation brings out.
External CFD: dry coolers, plume recirculation, heatwave, heat island
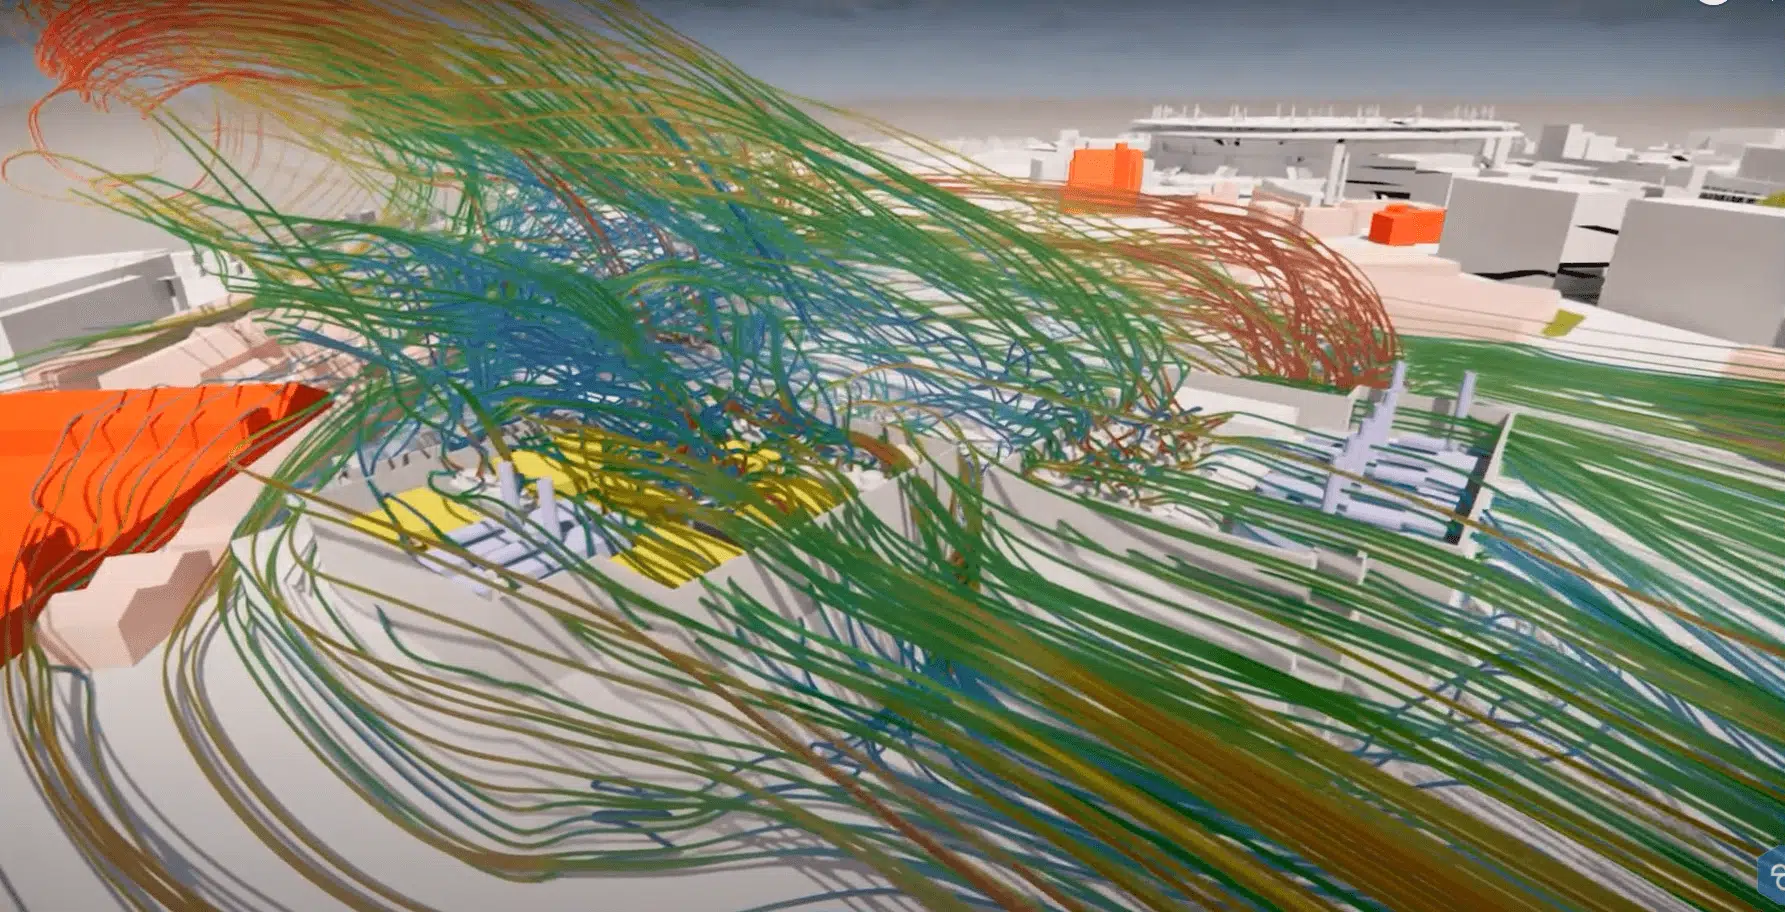
The whole cooling chain depends on a single physical quantity: the temperature of the air actually drawn in by the outdoor heat exchangers. And that temperature is not the one from the weather station. It results from the interaction between the hot exhausts of the installation, the geometry of the roof and of the site, and the wind. That is the object of external CFD.
Plume recirculation, the central mechanism
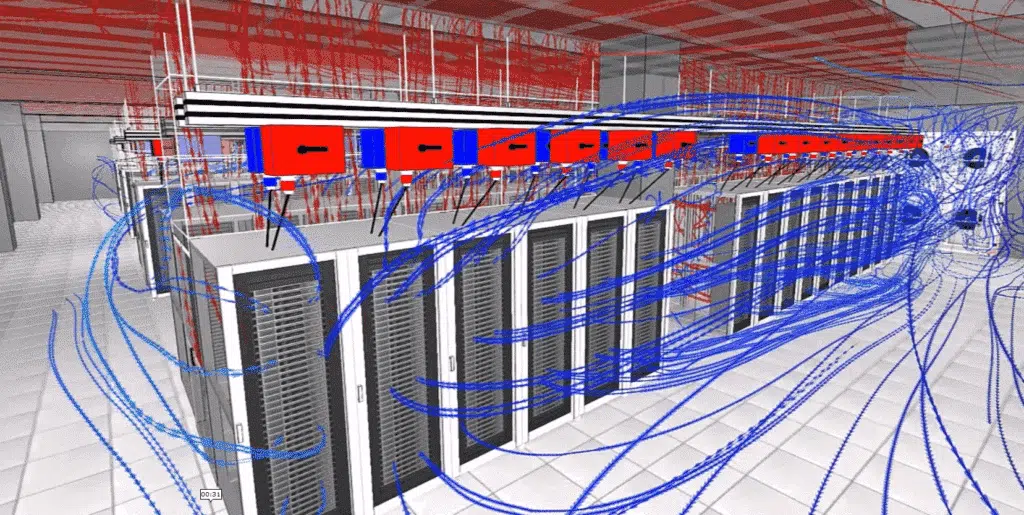
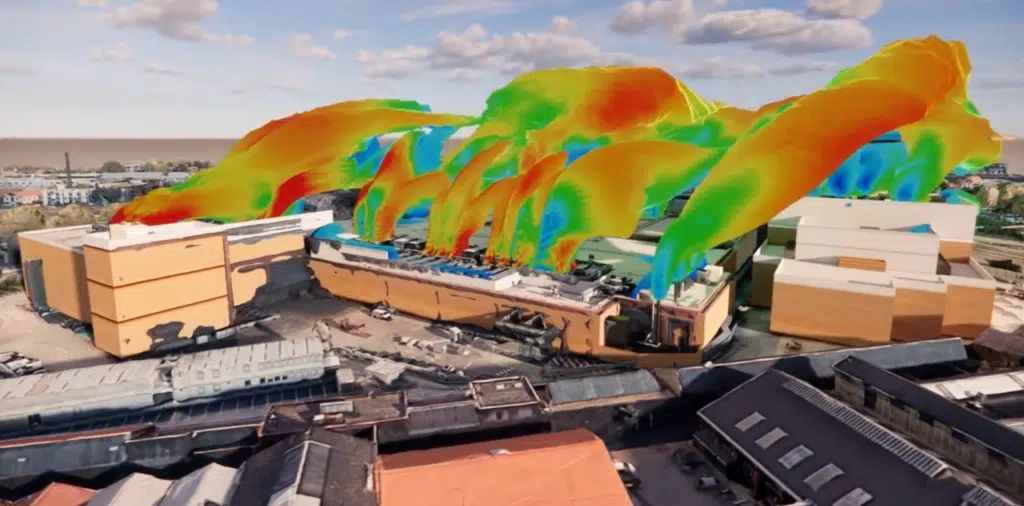
Re-ingestion, by a dry cooler or a generator set, of all or part of the hot air it has just rejected: directly or after reflection on an obstacle, a parapet or an acoustic enclosure. The result is a rise in the inlet air temperature that degrades the available cooling capacity at the very moment when it is most needed.
Plume recirculation is a self-aggravating mechanism: the machine whose inlet air heats up sees its performance fall, draws more power, therefore rejects more heat, and feeds its own plume. The at-risk configurations are well identified: machines too close together, exhausts directed towards a neighbouring intake, high parapets trapping hot air, badly sized acoustic enclosures, and neighbouring buildings creating a wake that pushes the plumes back down onto the roof.
The questions handled externally
- Temperature rise at the intake Of each machine, by wind direction and speed, under heatwave conditions.
- Rooftop layout Spacing, discharge height, orientation, ducting or discharge nozzle, screens and windbreaks.
- Generator sets Dispersion of hot exhaust gases, interaction with fresh air intakes and dry coolers, a scenario where both systems operate simultaneously.
- Pressure drops Induced by enclosures, grilles, louvres and rooftop photovoltaic panels.
- Heat island Impact of the heat rejection at neighbourhood or campus scale, a subject that has become central in permitting procedures.
- Air quality and acceptability Plume dispersion, a health question for wet cooling devices.
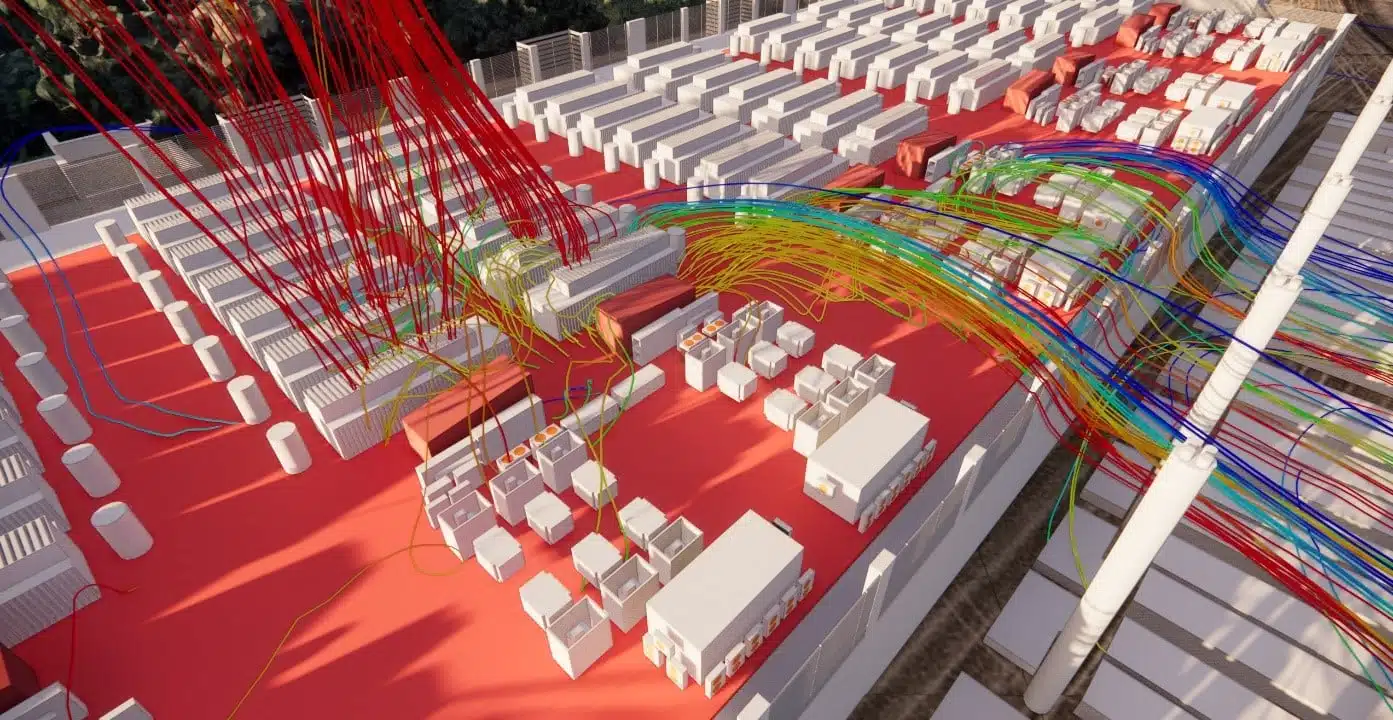
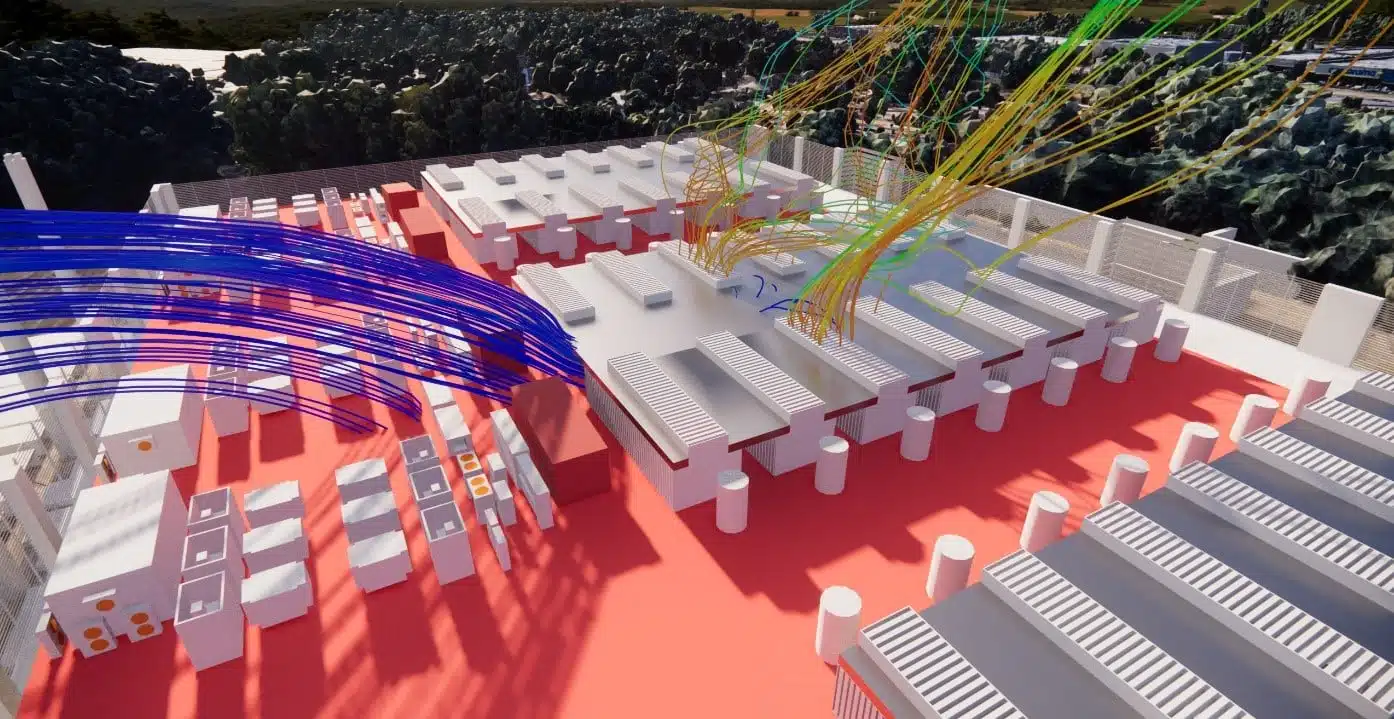
The link with the internal study is direct and quantifiable: every degree gained at the machine intakes translates into available cooling capacity, therefore chilled water temperature, therefore margin on the supply setpoint. That is why we increasingly handle both scopes in a single coupled assignment, rather than as separate studies.
Plume recirculation on a roof does not stay on the roof. It works its way back into the chilled water, into the supply setpoint, and ends up on the face of the worst-placed rack.
Chapter 15 · propagation between scalesFire, smoke control and gas extinguishing: simulating the unacceptable
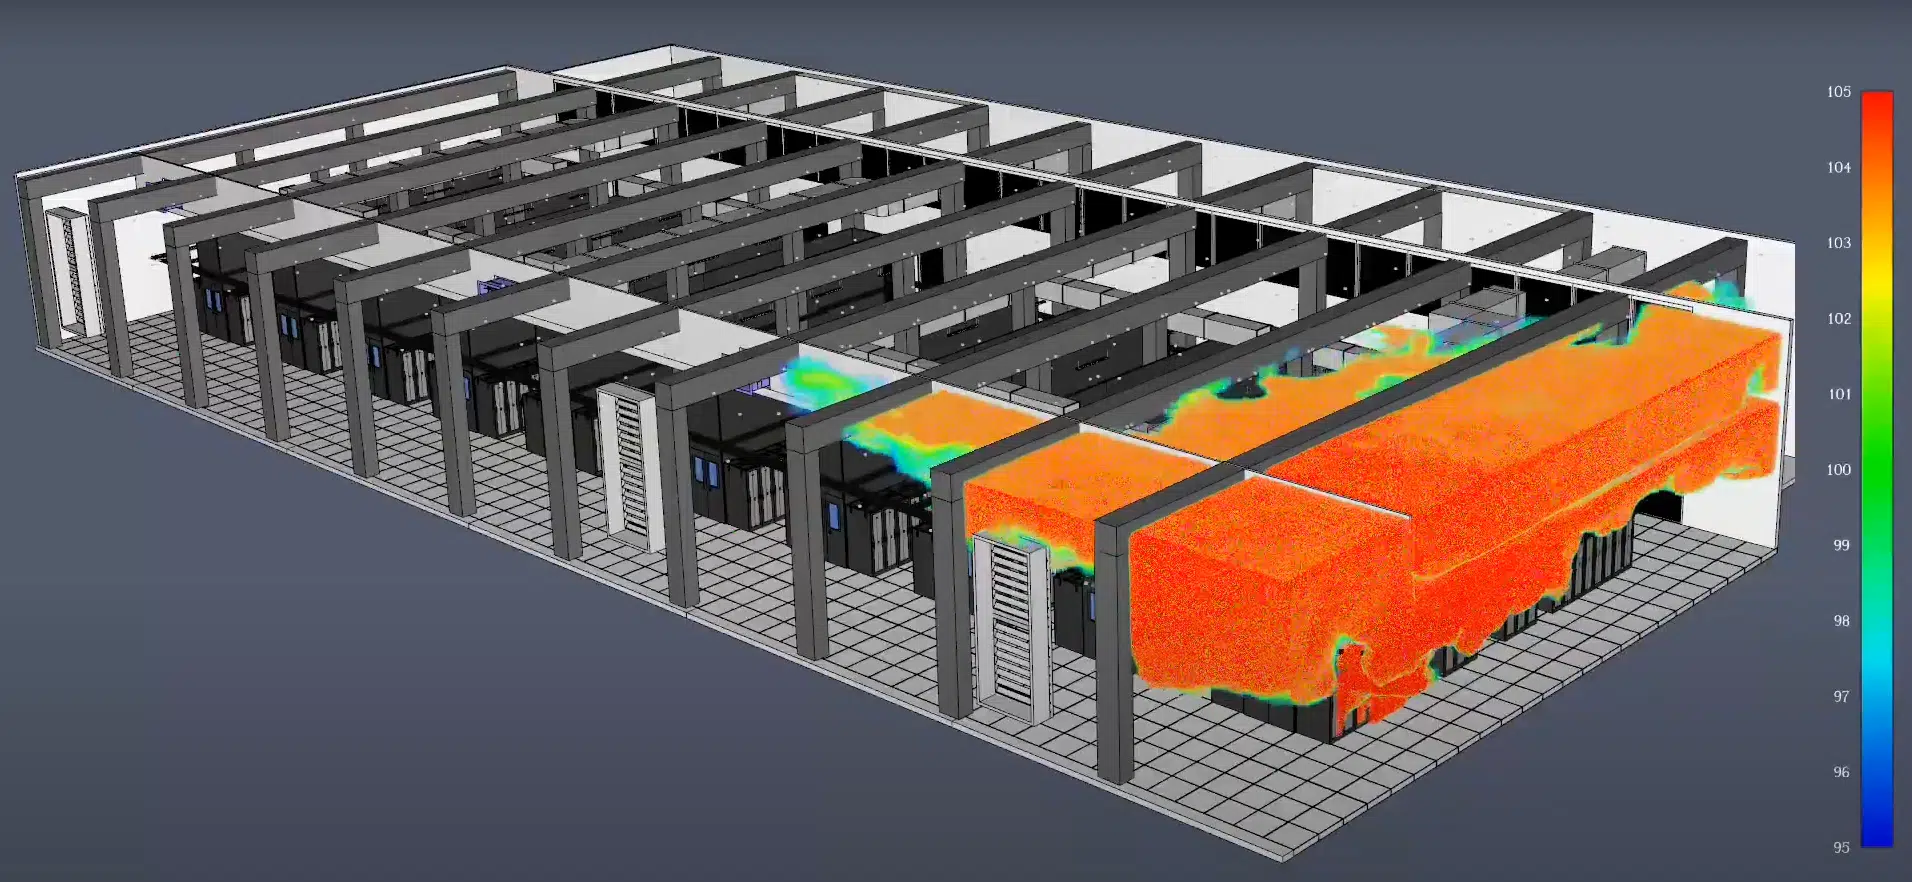
The fire risk of a data center has its own characteristics: a high concentration of electrical energy, combustibles producing dense, toxic and corrosive smoke, and a stake that is not only human but also material: combustion products attack electronics far beyond the burned zone. Simulation changes objective here: we no longer look for comfort, we look for tenability and control.
What is computed
- Fire development And possible spread to neighbouring racks, radiation included.
- Temperature, visibility and toxicity fields At head height, along the evacuation and intervention routes.
- Effectiveness of smoke control Extraction airflows, position of vents and air inlets, smoke-free height, stagnation zones.
- Interaction with comfort ventilation An AHU that keeps running can stir the smoke and destroy the stratification that smoke control seeks to establish.
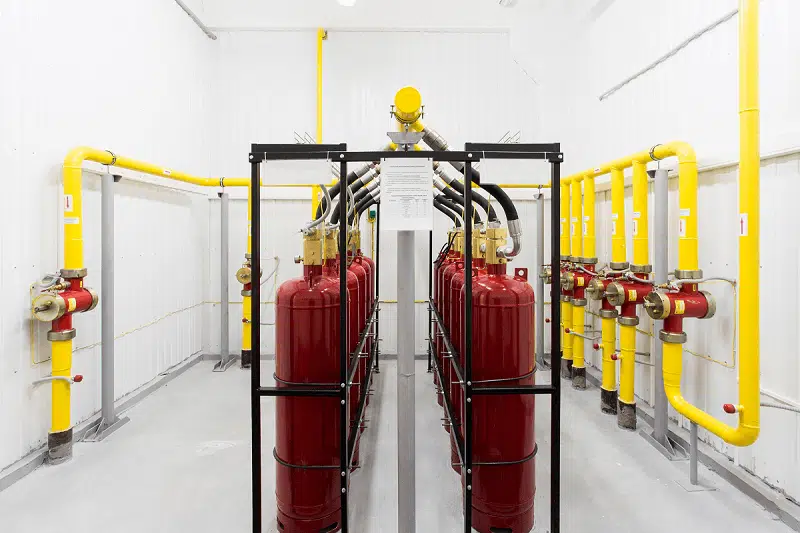
- Automatic gas extinguishing Dispersion and homogeneity of the agent concentration, hold time of the concentration, aeraulic effects of the discharge and overpressure.
- Compartmentation Real effectiveness of the separations and of the closing devices.
Two modeling requirements set fire apart from the rest: the computation is necessarily transient, over durations of several tens of minutes, and density must be treated as fully variable: the Boussinesq approximation has no validity left with differences of several hundred degrees. Radiation becomes a first-order transfer mode, and the definition of the design fire (power, growth curve, area, soot production) must be justified against the applicable framework.
PUE: where CFD really acts, and where it does not
PUE relates the total energy of the site to the useful energy of the IT equipment. It is simple, imperfect, universally used. And it is stagnating: 1.54 as a global average, unchanged for six consecutive years according to the Uptime Institute, against 1.10 to 1.15 claimed by hyperscalers and 1.58 to 1.80 observed in colocation and enterprise. The gap is not technological: it is aeraulic and operational.
The five levers simulation acts on
| Lever | Mechanism | Condition to be proven |
|---|---|---|
| Raise the supply setpoint | Better cooling production efficiency, more free cooling hours | No rack intake outside the range, including in degraded mode |
| Reduce the ventilation airflow | Fan power varies roughly as the cube of the airflow | Airflow ratio kept > 1, no induced recirculation |
| Increase the ΔT | Less airflow for the same power, better heat exchange | Sealed containment, otherwise the hot return feeds the hot spots |
| Remove the bypass | The cold air produced finally serves to cool; the return ΔT rises | Locate the leaks: tiles, brushes, plenum |
| Stop redundant units | Run with fewer units but better distributed | Acceptable behaviour in the event of the loss of a remaining unit |
The global PUE is not stuck at 1.54 for lack of technology. It is stuck because nobody dares raise a setpoint without proof.
Chapter 17 · the real potentialConversely, one has to be clear about what CFD does not do: it improves neither the efficiency of a chiller, nor that of a UPS, nor the load factor of the IT equipment. A PUE degraded by a very low load factor is not corrected by an airflow study: it is corrected by consolidation. Knowing how to tell the two situations apart avoids selling, and buying, the wrong study.
Guide to calculating PUE Energy optimization & PUEAssignment, lessons learned and limits
How a study runs, what ten years of assignments have taught us, and the questions to ask before signing.
How an assignment runs: deliverables, lead times, output format
Our reference commitment on a data hall is four weeks, from scoping to presentation: and we know how to go faster when the project schedule demands it.
A CFD study is not an isolated computation but a sequence of decisions shared with the design team and the operator. The sequence below is the one we apply: one calendar month, with phases partly run in parallel. Our in-house computing resources make it possible to compress that lead time to two or three weeks in an accelerated procedure: a commissioning trade-off, an urgent layout decision, an incident to investigate. Only two situations really extend it: a very large number of transient scenarios, and waiting for input data on the operator's side.
Scoping & data collection
Precise definition of the questions the study has to answer, of the compliance criteria retained and of the list of scenarios. Collection of drawings, technical data sheets, BMS records and real powers.
Site survey (existing facility)
Measurement campaign on site, in one to two days of intervention: intakes, tile airflows, pressures, thermography, smoke test where useful. Power consistency check carried out immediately afterwards.
Modeling & meshing
Construction of the workable 3D model: useful geometry, calibrated porous media, boundary conditions. Hybrid mesh, refinement of gradient zones, independence study.
Calibration on measurements
On an existing installation: adjustment of the poorly known parameters until agreement with the survey. The model becomes the digital twin of the site: it is the deliverable that outlives the study.
Scenarios & iterations
Computation of the nominal duty then of the degraded scenarios, launched in parallel on our computing resources. Testing of the proposed remedies, one by one, to isolate the effect of each.
Analysis & presentation
Maps, sections, trajectories, animations, indicators (RCI, RTI, CI) and an action plan ranked by effect/cost ratio. Technical presentation meeting with the operations teams.
Life of the model in operation
The digital twin stays available: every densification, every rack move or setpoint change is tested on the existing model in a few days, without starting from scratch. That is what turns CFD from a project deliverable into an operations tool.
Lessons from the field: what we have learned on site
Six assignments, six different mechanisms. The detailed case files, with configurations and results, are published on this site.
Data halls DC10 · DC17 · DC25
Series of internal studies on rooms with evolving load: under-floor distribution, recirculation effects and behaviour as load ramps up. Recurring lesson: the announced capacity of a room is almost always limited by its worst rack, not by its average.
Hyperscale data center · internal + external
Coupled envelope and room study on a high-density site: internal performance could not be guaranteed without first dealing with the behaviour of the rooftop heat rejection. A direct illustration of the propagation between scales of chapter 02.
Technical rooms & UPS (Italy)
Data hall and UPS rooms handled together. Electrical rooms, often outside the scope of studies, frequently turn out to be more constrained than the server room itself.
Dry coolers in a heatwave
Critical study of the behaviour during a heatwave episode: identification of heat accumulations and of plume recirculation on the rooftop machines, with a direct effect on the available cooling capacity.
Commissioning & load banks
Modeling of the testing phase: load banks reproduce neither the geometry nor the flow distribution of the real IT equipment. A successful handover therefore does not prove healthy operation: unless the discrepancy has been simulated.
Data hall smoke control
Fire scenarios contained to one rack then with spread: compartmentation and channelling of the flows determine tenability for responders far more than raw extraction airflow.
Classic mistakes observed in operation
These situations come back on almost every site we audit. None of them stems from a sophisticated engineering error: they are operational drifts or design shortcuts, with a disproportionate thermal effect.
The hot spot recedes by a few degrees, the bill rises all year round and the aeraulic cause remains intact. At the next load addition, the problem comes back: with less margin than before.
identify the mechanism (recirculation, bypass, plenum) before touching the setpointEvery free U left unblanked is a direct short circuit between hot aisle and cold aisle. The cumulated effect over a row often exceeds that of a whole cooling unit.
systematic blanking panels, including on partly filled racksAdding tiles right next to a dense rack lowers the local plenum pressure and can degrade the airflow of neighbouring tiles, or even reverse some of them.
check the plenum pressure field before adding any tileThe under-floor plenum is an air distribution network, not a storage space. Historical layers of cable create obstacles that starve whole zones of air, often far from the point of accumulation.
map the obstructions, clear the main axes, remove abandoned cablesA floor cut-out with no brush grommet lets a significant flow of cold air escape, outside any rack. It is the cheapest bypass to correct and the most frequently ignored.
brushes or seals on all openings, including in the hot aisleRunning every unit, redundant ones included, at maximum speed strongly increases fan consumption (which varies roughly as the cube of the airflow) and creates jet interference that degrades distribution instead of improving it. The safety being sought is illusory: it is never demonstrated on the unit-loss scenario, the only case where it would count.
test the reduced configurations in simulation, then replay them on the digital twin at every change of loadInserting a GPU island into a room designed for low homogeneous density produces an instantaneous hot spot, whatever the total cooling capacity available.
prior aeraulic requalification and choice of location through residual capacity mappingThe most expensive case of all: a study delivered, read, applied, then forgotten. Six months later, the room has changed load and nobody knows whether the conclusions still hold. Yet the model existed, calibrated and ready to replay the case in a few days.
keep the digital twin alive: update it at every densification and test the layout before every rack deliveryPanel not put back, door blocked open, rack removed without blanking: the containment loses much of its benefit, with no alarm and no trace.
reinstatement checklist after every intervention, periodic thermographic checkIn a presentation meeting, the question asked is practically never "where are the hot spots?": operations already know them. It is "what can I do on Monday, without stopping production?". That is why the action plan is ranked by effect/cost ratio, and why the remedies are tested one by one in the model: so that we can say which one is sufficient on its own.
Limits of CFD and questions to ask your provider
An honest white paper must say where the tool it presents stops. CFD is powerful; it is also easy to misuse, and a wrong result is visually indistinguishable from a right one.
What CFD cannot do
- Compensate for bad input data. An approximate IT power or an obsolete geometry produces an approximate result, whatever the refinement of the computation.
- Predict the behaviour of a control system that is not modeled. Controllers react to measurements: if the control strategy is not described, the computed transient is only one scenario among others.
- Replace measurement. It organises and interprets measurement; it does not replace it, and on an existing site it depends on it.
- Settle non-aeraulic questions. Electrical reliability, cybersecurity, machine efficiency: out of scope.
- Stay valid indefinitely. A model describes one state of an installation. Any change of load or layout calls for an update of the digital twin.
Eight questions to ask before ordering a study
Which output quantities and which compliance criteria will be delivered, and against which framework?
Which turbulence model is selected, and why that one?
Will mesh independence be demonstrated in the report?
Will the mass and energy balances be provided?
On which measurements will the model be calibrated, and which computation/measurement deviations are considered acceptable?
How are the fans (curve or fixed airflow) and the leaks represented?
Which degraded scenarios are included, steady-state or transient?
Will the model be delivered and reusable for future changes, or is the study a dead deliverable?
Internal and external CFD studies, failure scenarios, PUE, fire safety: our engineers work alongside you from design to operation.
A team document, not a single author
At EOLIOS, a study is never the work of a single engineer: it is produced, recomputed and reviewed by a team. This white paper follows the same rule: it is signed by the Data Center team, and it is the consultancy that answers for it, not a person, exactly as for the studies we carry out.

The content comes from our own assignments: on-site measurement campaigns, models tuned on survey data, failure scenarios computed in house. When a figure comes from an external reference, it is cited in appendix C; when it comes from our practice, it is written in the text.
Frequently asked questions
What is a CFD study used for in a data center?
It numerically reconstructs the air flows and temperatures of a data hall to check that each rack receives air at the target intake temperature, including in a degraded configuration. Concretely, it serves to validate a design before works, to diagnose existing hot spots, to test failure scenarios with no operational risk and to release IT capacity without heavy investment.
What is the maximum density that can be cooled by air?
With air alone, with aisle containment and a correctly sized plenum, the practical limit generally lies between 15 and 25 kW per rack. Between 25 and 40 kW, in-row or active rear-door architectures become necessary. Beyond 40 to 50 kW, direct liquid cooling becomes the only realistic route: ASHRAE has moreover extended its recommendations to liquid-cooled equipment for those densities.
How many m³/h of air are needed to cool a rack?
About 3,100 m³/h per kW dissipated, divided by the temperature difference across the rack. For a 10 kW rack with a ΔT of 12 K: about 2,600 m³/h, i.e. roughly 260 m³/h per kW. A higher ΔT reduces the airflow and the fan energy, but makes containment and aisle sealing far more critical.
What is the difference between internal and external CFD?
Internal CFD deals with the data hall and the technical rooms: air distribution, hot spots, recirculation, containment, failure scenarios, fire. External CFD deals with the envelope and the roof: intake and discharge of the dry coolers, plume recirculation, interaction with wind and neighbouring buildings, heatwave, heat island.
The two answer each other: an outdoor air temperature degraded by plume recirculation feeds straight back into the performance of the cooling production, and therefore into the room.
How long does a data center CFD study take?
Our reference sequence fits into one month: a few days of scoping and data collection, one week including the site survey, one week of modeling and meshing, one week of computations and iterations on the scenarios, then one week of analysis and presentation. In an accelerated procedure, we go down to two or three weeks. Only a very large number of transient scenarios or an extended internal/external coupling calls for more computing time.
Is a CFD simulation reliable?
It is reliable if it is verified and validated: mesh independence demonstrated, residuals converged, energy and mass balances closed, and comparison with field measurements when the installation exists. An unvalidated CFD remains a hypothesis, not a result: and nothing, visually, distinguishes the two.
Can CFD reduce PUE?
Indirectly but genuinely. It does not act on machine efficiency: it acts on the aeraulic potential, raising the setpoint without exceeding the limits at the racks, removing overcooling, reducing the ventilation airflow, increasing the ΔT, extending free cooling. Those are the items that weigh most in the cooling share of PUE, whose global average has been stuck around 1.54 for six years.
Can a CFD be run on a new-build project, without measurements?
Yes, and it is even the most frequent case in design. Confidence then rests on models validated on analogous cases, explicitly stated conservative assumptions and a sensitivity analysis on the uncertain parameters. At commissioning, a measurement campaign makes it possible to tune the model and turn it into the digital twin of the site for its whole lifetime.
Sources & standards
The market data quoted in this white paper come from public, dated and verifiable sources. Technical standards must always be consulted in their edition in force: the values reproduced here are indicative.
- 01International Energy Agency (IEA), Energy and AI, World Energy Outlook Special Report, April 2025: 415 TWh consumed by data centers in 2024 (≈ 1.5 % of global electricity), growth ≈ 12 %/year since 2017, projection ≈ 945 TWh in 2030 in the base case. iea.org
- 02Uptime Institute, Global Data Center Survey 2025 (15th edition), July 2025: global average PUE ≈ 1.54, stable for the sixth consecutive year; rising densities in the 10–30 kW range, one site in eight reporting racks of 30 to 59 kW. uptimeinstitute.com
- 03ASHRAE Technical Committee 9.9, Thermal Guidelines for Data Processing Environments: recommended and allowable intake air ranges, classes A1 to A4, extension to liquid-cooled equipment for high densities.
- 04EN 50600 series (and ISO/IEC 22237): design, construction and operation of data centre facilities and infrastructures; energy efficiency indicators.
- 05Uptime Institute, Tier Standard: Topology & Operational Sustainability: Tier I to IV classification, concurrent maintainability and fault tolerance.
- 06Lawrence Berkeley National Laboratory, 2024 report on the electricity consumption of US data centers: 176 TWh in 2023, projection of 325 to 580 TWh by 2028.
- 07European regulatory framework: nomenclature of installations classified for environmental protection (ICPE) applicable to generator sets, refrigerants and cooling towers; European F-Gas regulation on fluorinated greenhouse gases.
- 08EOLIOS technical publications: all the dossiers and project sheets quoted in this white paper are accessible from our Data Center resources.
2026 edition of the EOLIOS white paper. The engineering orders of magnitude given in the tables (density ranges, indicator targets, assignment durations) reflect our practice and do not constitute normative values: every project must be checked in its own context.