Overheating : an air-path problem, not a cooling-capacity one
In the vast majority of server rooms, a hot spot does not reflect a shortfall in cooling production : the chiller is running, the supply air is at the right temperature. The problem lies elsewhere — the cold air does not reach where it should, or the hot air returns where it should not.
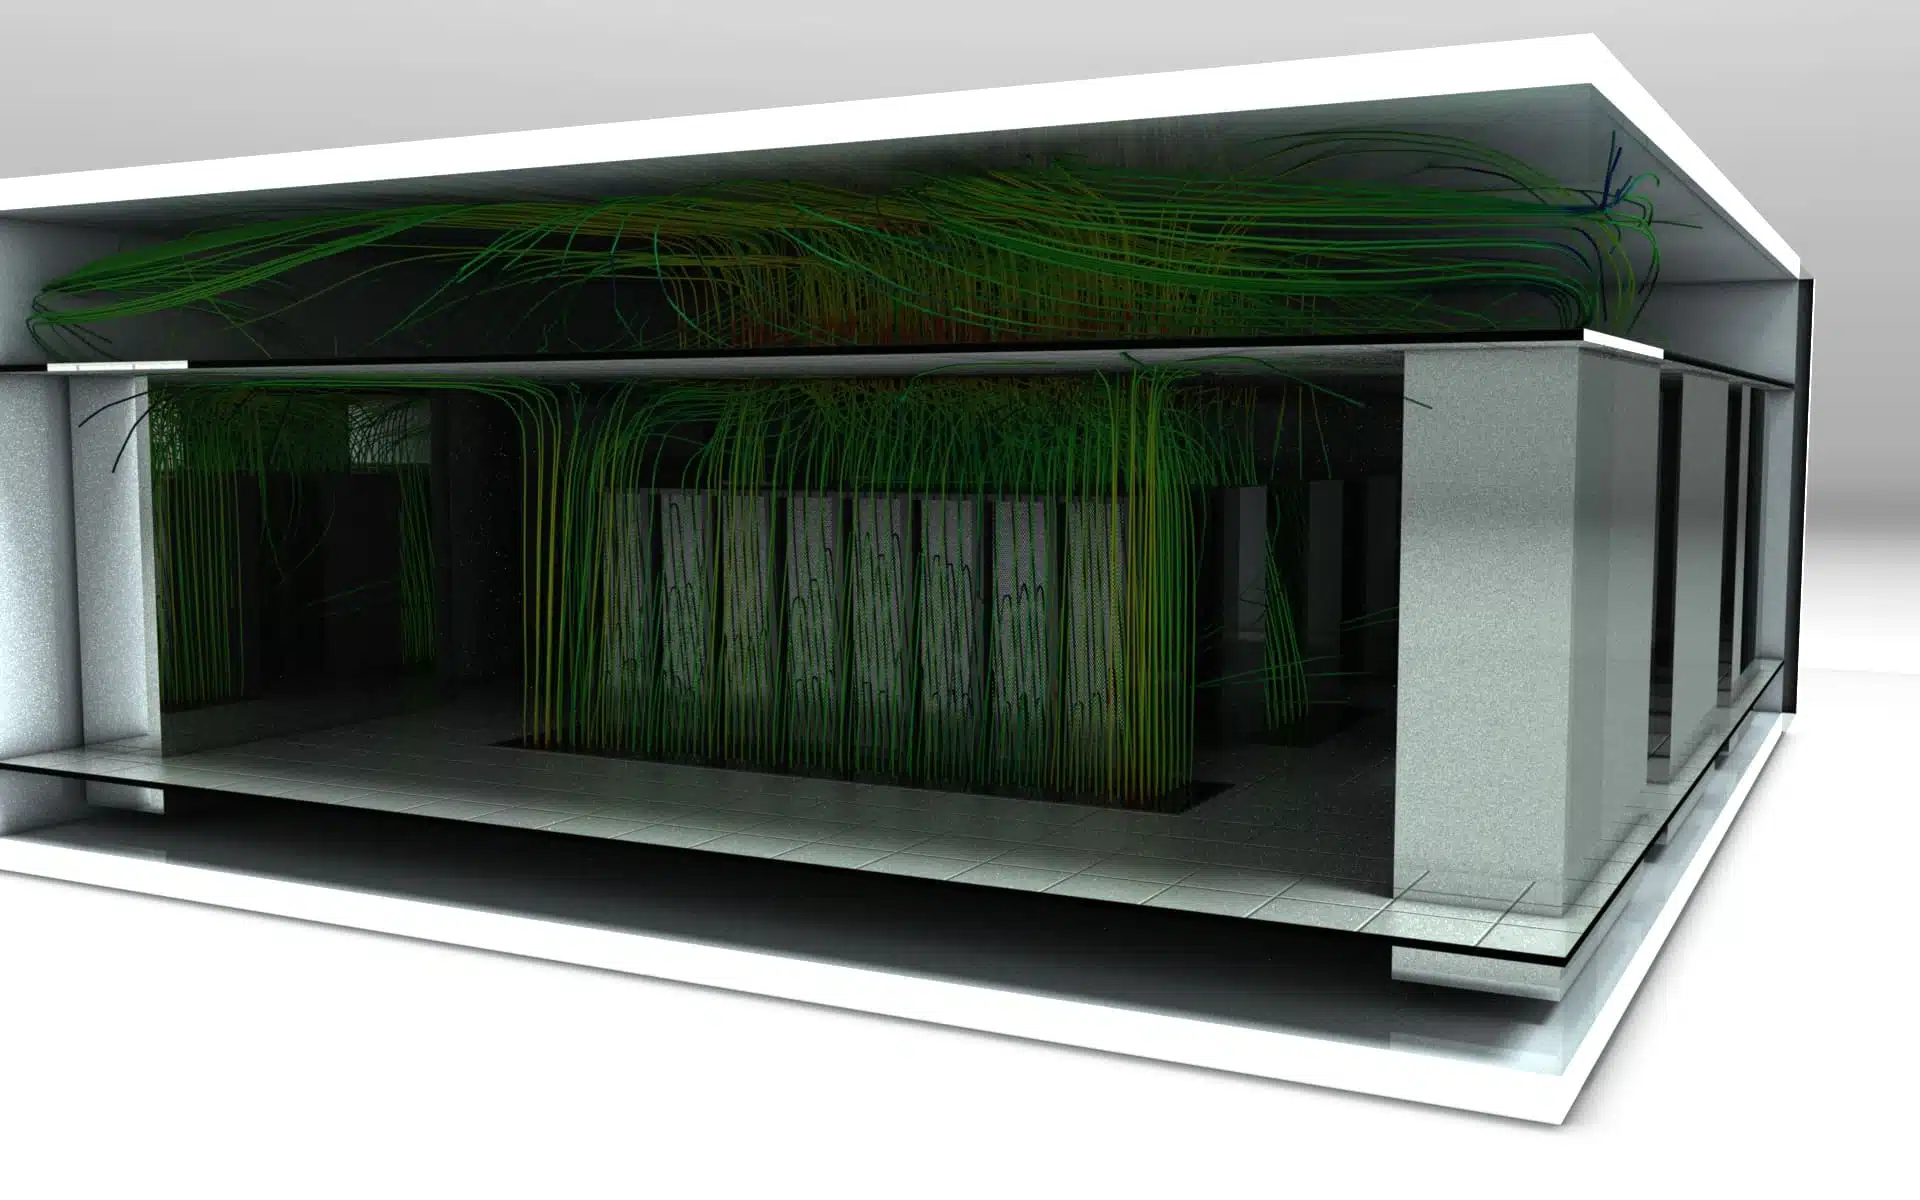
Understanding the origin of overheating therefore means, above all, following the path of the air through the room : from the supply vent to the servers' intake, then from their hot exhaust back to the air-handling units' return. This is exactly what CFD simulation allows you to visualise, point by point, before undertaking any work.
What is a hot spot?
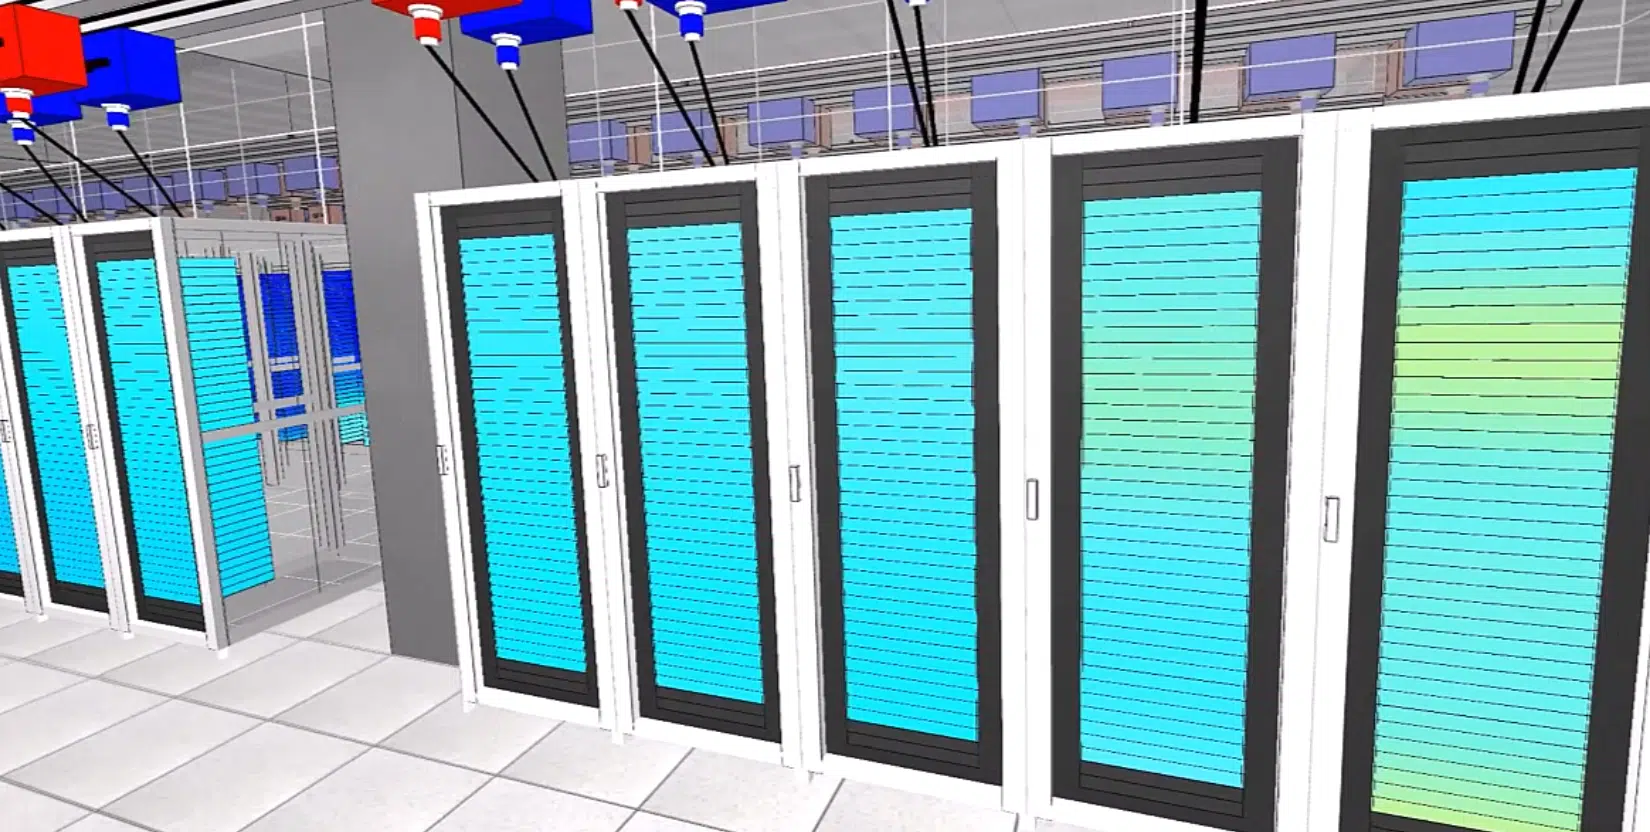
A hot spot is a localised zone where the intake air temperature of one or more servers exceeds the manufacturer's recommendations or the ASHRAE ranges. It almost always results from a mixing of rejected hot air and supplied cold air, before the latter reaches the equipment.
A well-designed data center rests on a simple rule : strictly separate cold air from hot air. This is the principle of cold aisles and hot aisles. As long as this separation holds, each server draws in air at the right temperature. As soon as it breaks — through a leak, a passage, an imbalance — a hot spot appears.
The airflow causes : recirculation and bypass
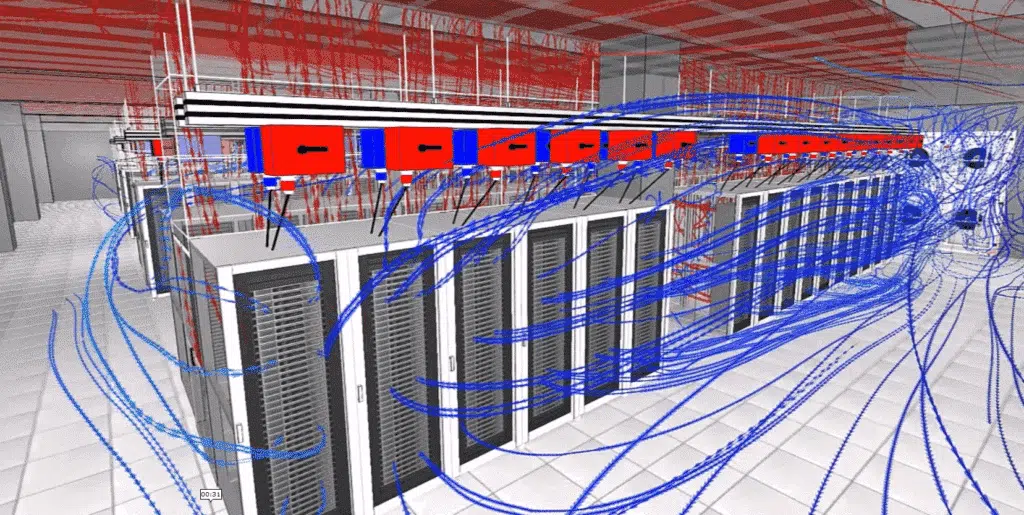
Two opposite but complementary phenomena explain most overheating. Both reflect a breakdown of the hot/cold separation.
Hot-air recirculation
- The hot air rejected by the servers goes around the rack and returns to the front intake.
- Typical at the top of racks, where cold flow is lacking and hot air "falls back".
- A direct cause of hot spots : the intake temperature rises locally.
Cold-air bypass
- The supplied cold air short-circuits the servers and returns directly to the CRAC/CRAH.
- Waste : this "lost" cold cools nothing and degrades efficiency.
- Often caused by poorly placed perforated tiles or unsealed passages.
Recirculation causes overheating ; bypass causes energy waste. The two almost always coexist in an uncontained room, and worsen each other when flow rates are unbalanced.
Adding more cooling can make it worse
Faced with a hot spot, the reflex is often to lower the setpoint or open more tiles. But if the cause is recirculation, this mainly increases the bypass and the consumption, without treating the hot zone. The right lever is almost always airflow-related, not refrigeration-related.
The causes related to the room's layout
The room's geometry and layout directly govern the air path. The most frequent sources of mixing :
Incomplete containment
- Unclosed aisles, missing doors, open ceilings.
- Hot and cold air communicate over the top of the racks.
Faulty sealing
- Empty U slots without blanking panels.
- Cable entries, unsealed raised-floor cut-outs.
Raised floor & tiles
- Insufficient plenum height, obstructions from cable trays.
- Too many or poorly positioned perforated tiles.
Each of these defects, taken alone, seems minor. Combined, they create diffuse leaks that ruin the hot/cold separation and shift hot spots from one zone to another as the room is modified.
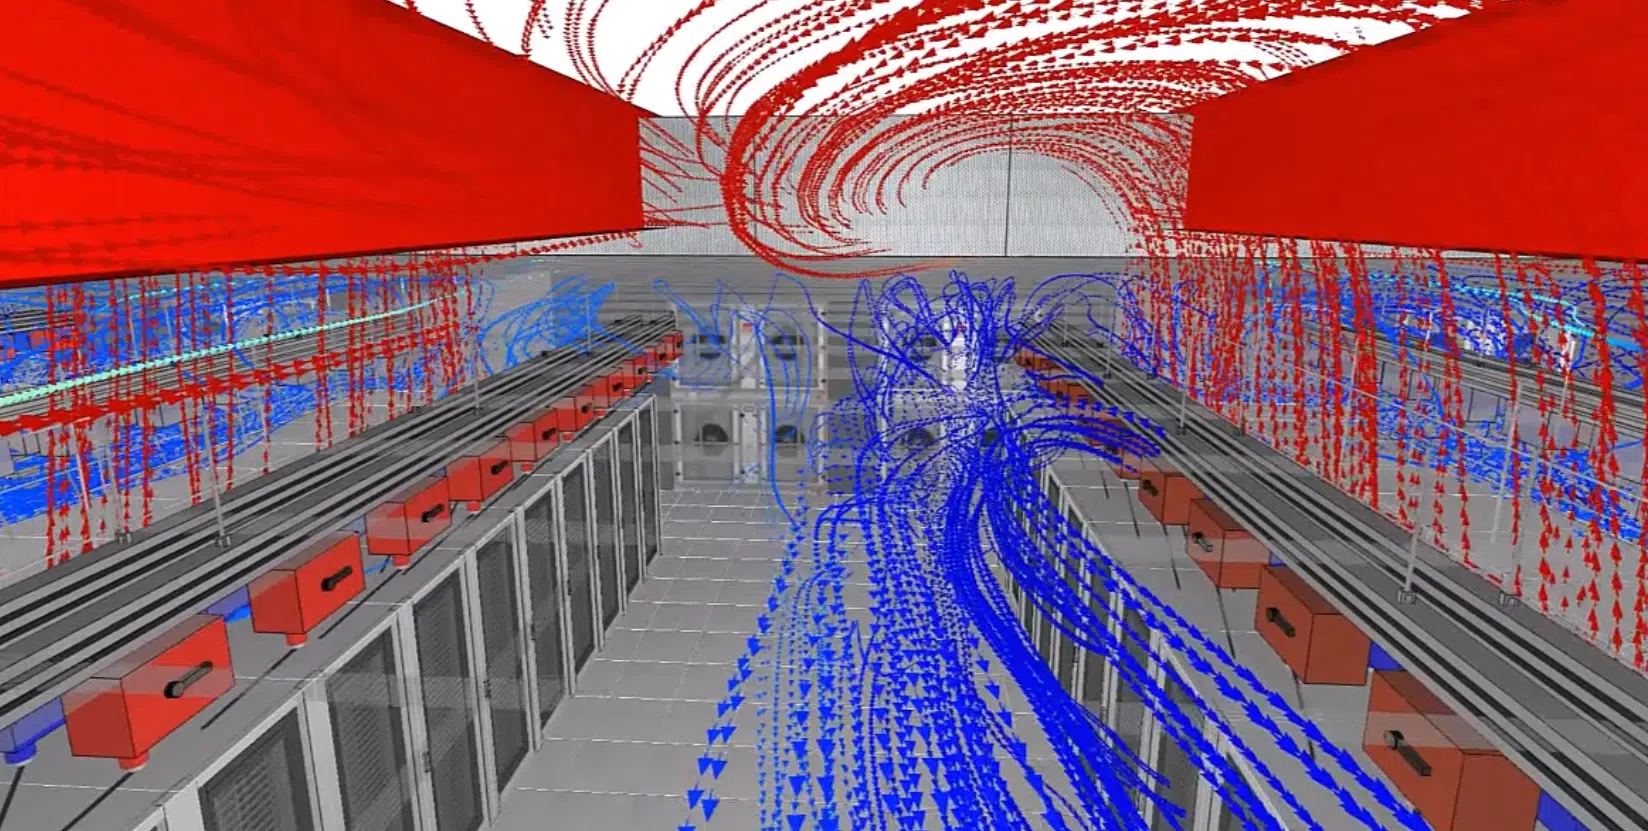
The causes related to load and operation
A room that is healthy at handover can develop hot spots in operation, simply because the load evolves and the airflow has not kept up.
Ramp-up & density
- Rack densification (HPC, AI, GPU) beyond the planned airflow.
- Power concentrated on a few poorly distributed "hot" racks.
Failures & redundancy
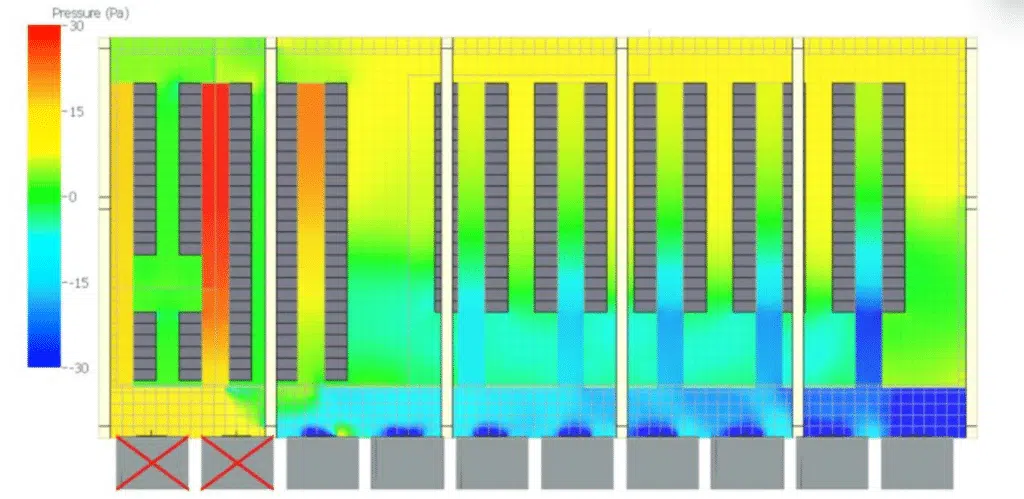
- A CRAC/CRAH shutdown : the local flow collapses and a hot spot appears.
- Failure scenarios (N+1) rarely checked beforehand, before the incident.
This is why the diagnosis must not be limited to nominal operation : it is also necessary to simulate the degraded scenarios (a unit failure, a load peak) to verify that the room stays within its margins.
Why overheating is costly
A hot spot is not merely a thermal anomaly : it is a risk to availability, to equipment lifespan and to the energy bill.
Availability
- Processor throttling, safety shutdowns, even failures.
- Loss of service on critical infrastructure.
Equipment
- Accelerated ageing of components exposed to heat.
- Higher failure rates, manufacturer warranties at risk.
Energy
- Setpoint lowered "for safety" across the whole room.
- Over-consumption and degraded PUE across the entire operation.
Treating a hot spot locally often makes it possible to raise the room's general setpoint — and thus to cut the consumption of the whole fleet, well beyond the affected zone.
Locating and ranking the causes through CFD simulation
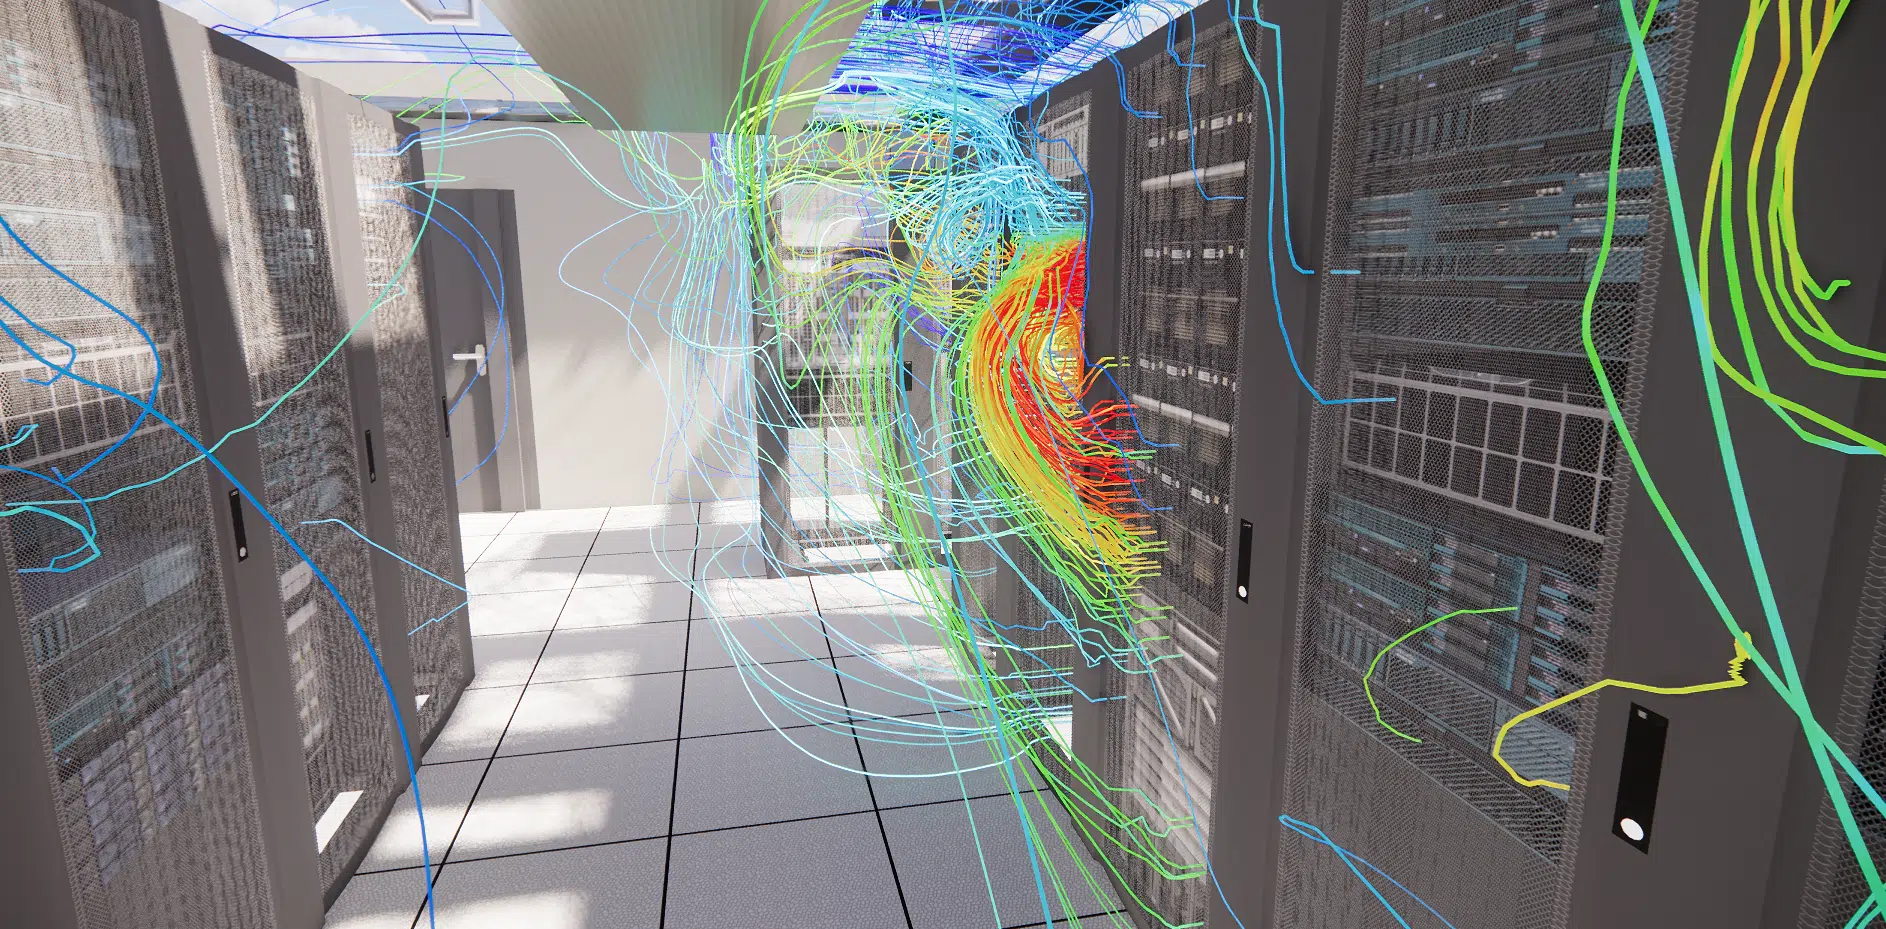
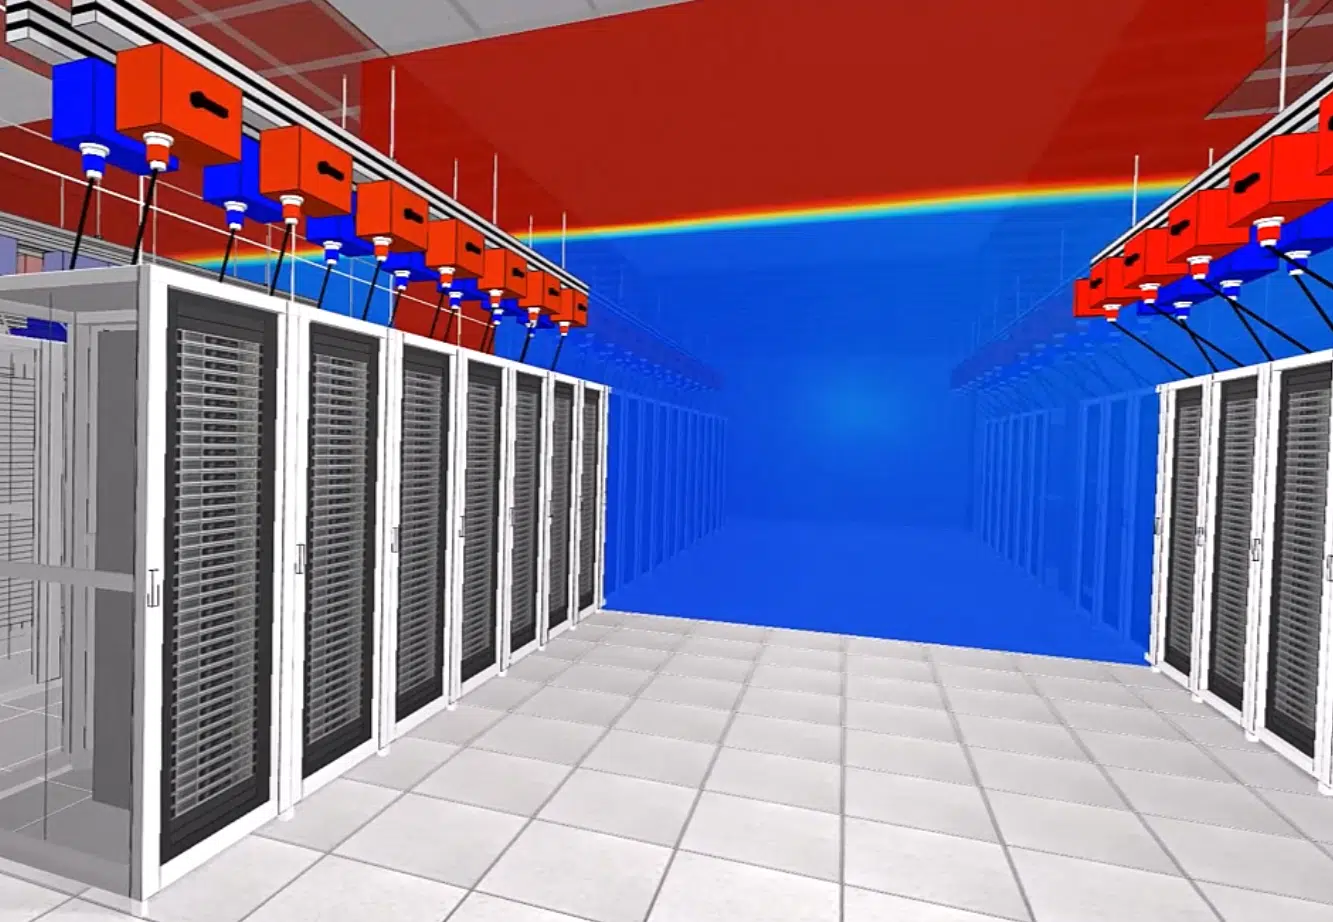
CFD simulation faithfully reproduces the room — geometry, racks, flow rates, powers — and computes the temperature and velocity field at every point. Where probes give only a few values, the model reveals the entire air path.
By building a digital twin of the infrastructure, the precise origin of each hot spot is identified, the causes are ranked (recirculation, bypass, sealing, flow), and corrections are tested virtually before committing to them — containment, tile repositioning, flow balancing.
The indicators that measure airflow health
Several indices make it possible to objectively quantify recirculation, bypass and a room's thermal margin. They turn a CFD map into usable figures.
| Indicator | What it measures | Reading |
|---|---|---|
| RCIHI/LO | Compliance of intake temperatures with the recommended / allowable ranges. | Close to 100 % = healthy room. |
| RTI | Return Temperature Index : ratio of server flow to air-handling flow. | > 100 % = recirculation, < 100 % = bypass. |
| ΔT | Temperature difference between rack intake and exhaust. | A low ΔT betrays mixing (bypass). |
| ASHRAE ranges | Recommended classes (A1–A4) of intake temperature and humidity. | Any rack out of range = hot spot. |
Correcting overheating — and preventing it
Once the causes are ranked, the correction levers are generally simple, low-cost and airflow-related before being refrigeration-related :
Restore the separation
- Contain the aisles (cold or hot) and close the passages.
- Fit blanking panels and seal the raised-floor cut-outs.
Balance & optimise
- Reposition perforated tiles as close as possible to the hot racks.
- Balance the flows, then raise the setpoint and extend free cooling.
Preventing, finally, means integrating CFD from the design stage and keeping it up to date as the load evolves : the digital twin then becomes an operational tool, not just a one-off diagnostic.
Our engineers build the digital twin of your room, locate the causes and cost the corrections. Let's talk.