Home » Laboratories » Study of dust in clean rooms » Fine dust measurements
Fine dust measurements
Audit to determine the propagation of dust during the destruction of a building
EOLIOS Ingénierie carried out an audit of the conditions of dispersion of dust during the destruction of a building near an OVHcloud site.
Fine dust measurements
Year
2022
Customer
OVH Cloud
Location
France
Typology
Dust study
Continue navigation :
Our other projects :
Latest news :
Objectives of the dust level measurement mission
The main challenge for the site is dust monitoring, specifically, whether the dispersion of particles can affect the operation of the site. For this mission, in a legal context, the EOLIOS team proposed its expertise to help the persons in charge of the data center to understand the impact on the server rooms of the phenomena of dusting induced by the destruction of the building nearby.
Placement of dust measuring equipment
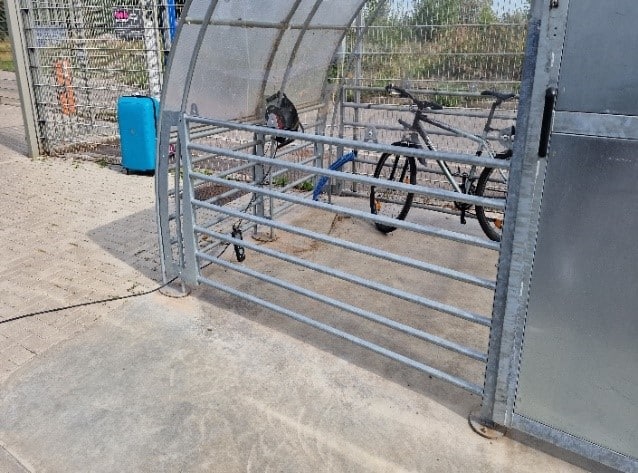
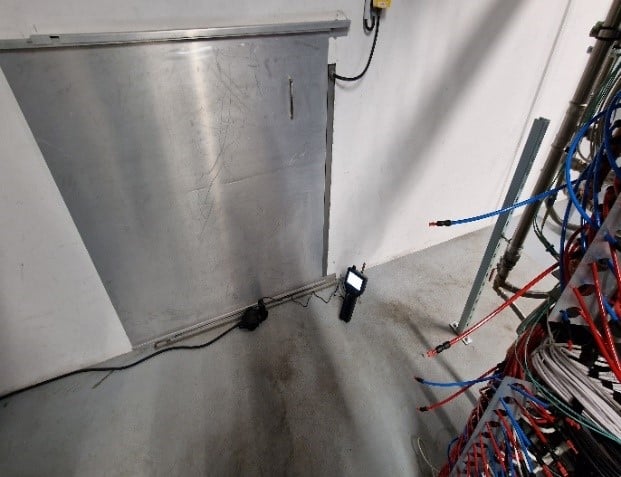
The main parameter is to know the quantity of dust present in the air, it is necessary to measure it in the vicinity of the site over several days at different times in order to analyze the concentration present.
These concentrations were taken in order to have a series of data and thus increase the reliability of the results. They were carried out with measuring devices under calibration certificate.
Observation of the movement of the dust plume
Several observations before and after destruction of the building were made.
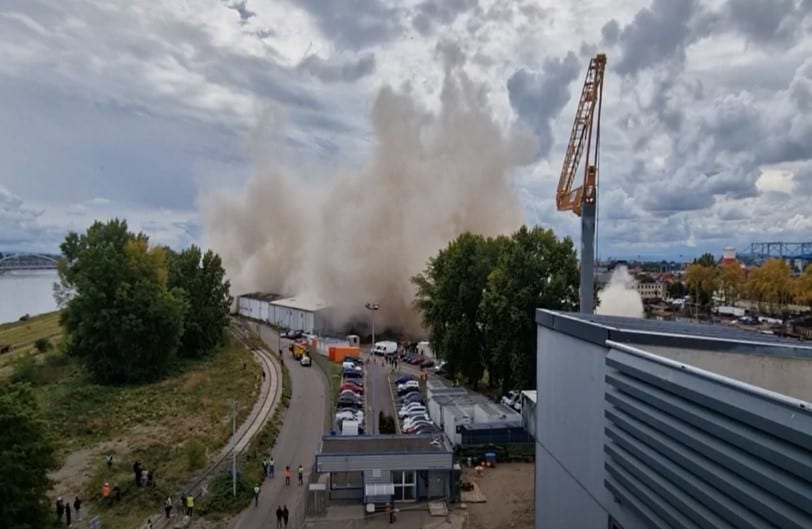
At the beginning of the explosion and demolition, a plume of dust created by the blast and the beginning of the collapse of the building appears.
When the building is completely destroyed, the dust plume rises and disperses. The visibility is totally obstructed. In addition, the disappearance of the adjacent building in the plume reflects a high plume density. The plume disperses mainly towards the data center and the canal due to adverse weather conditions and wind.
A dilution of the dust plume occurs with a loss of visibility. The concentration of particles remains high.
After 7min, the visibility is slightly obstructed by the presence of the dust cloud on the site. The data center is clearly exposed to a large dust cloud.
Real-time measurement of dust concentration in the air
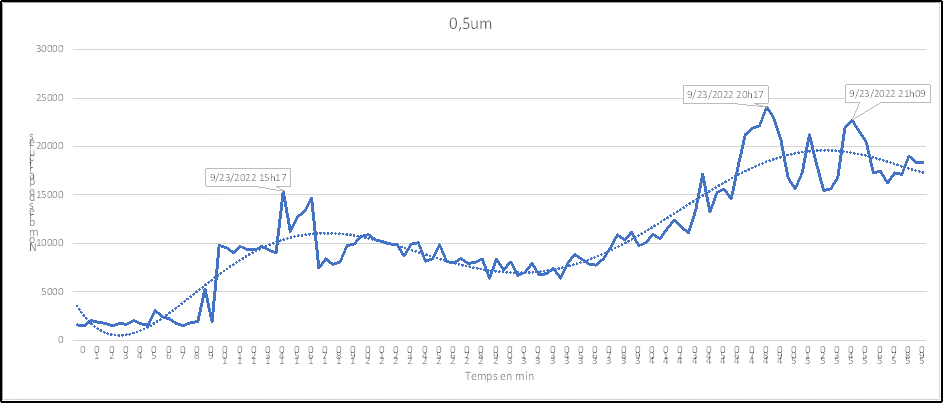
Different measurements were made, before, during and after the explosion on different dust sizes, 0.3µm, 0.5µm, 1µm, 2.5µm, 5µm and 10µm. As an illustration, we will only present the values at 0.5µm.
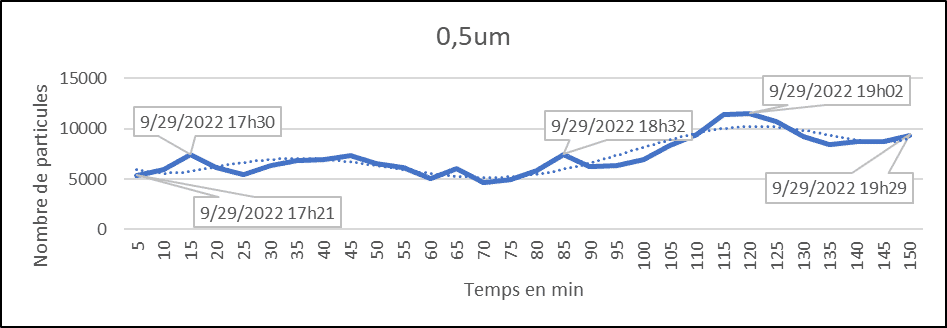
The beginning of the measurements (external) is realized from 18h with a decreased human presence, from where the weak presence of particles then a new increase due to the peak hours.
Average value : 0.5 µm= 10 000
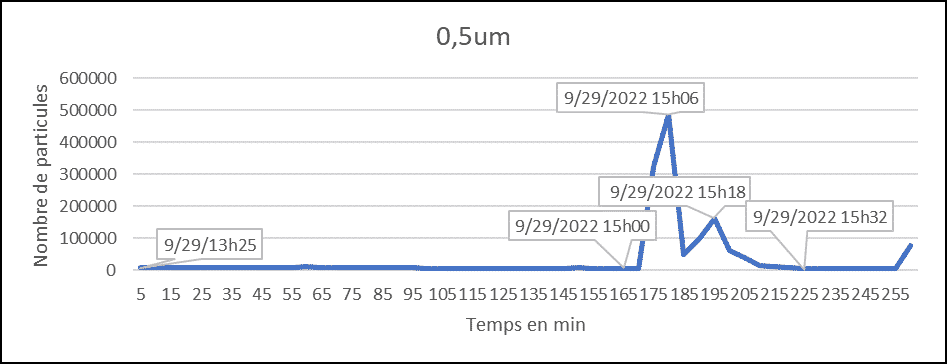
Measurement of the number of particles on October 29, before, during and after the day of the explosion from 1 pm with a measurement every 5 minutes.
The strong disturbance present on 9/29/2022 at 3pm is related to the start of the explosion when the sensor receives the particles.
There is a strong increase in values due to the explosion of the building in the vicinity of the site, with some values having a coefficient of over 130.
Average at 0.5 µm :
- Before explosion : 7000
- During explosion: 196 000
- After explosion: 15 600
30 minutes later, the level of particles is relatively equivalent (2 to 5 times higher than normal). The post-explosion averages are higher than the pre-explosion median values due to the persistent dust plume encompassing the study area.
After 2 hours following the destruction, the level of particles present in the air in the vicinity of the data center returns to a quantity close to the pre-destruction orders of magnitude. The average values are still slightly higher, resulting from the destruction and resumption of work on site.
Average value at 0.5 µm : 7 300
The day after the destruction, no particular contamination related to the presence of unstabilized gravel was noted, the values being in the average post-blast measurement range. The trend is also slightly down.
In-house measurement studies have been carried out, these data are not reported here.
Why carry out an audit and modeling of dust propagation?
Dust and particle auditing offers new perspectives for industries and other managers of sensitive sites. This makes it possible to measure, understand and define for a large number of risks related to a significant contribution of dust.
Thanks to its teams of engineers, EOLIOS is able to model by CFD simulation the propagation of dust inside and outside. Dusty spaces can be simulated in their entirety with great accuracy in a short period of time. Moreover, the experience of EOLIOS in general aeraulics allows our team to propose innovative and relevant solutions in the case of particle concentration problems.
Implementing an EOLIOS diagnostic in your design process means calling on experts in fluid mechanics, thermal and numerical simulations to ensure the proper functioning of your facilities.
Continue on this topic
Video summary of the site audit: dust measurement during a demolition explosion
L‘audit from site realisé for measure dust levels dyears l‘air hardant the destruction by explosion d‘a bâtiment and it has revélé that‘it y avhas a forte concentration from parules dyears l‘air in a short period of time. Real-time measurements have eté prises dyears the zone autour from site and à from distances more éloignées for diceterminer the concentration and the composition from parules. Visit rsultats have mountre that the concentration of particulate matter in the air was above the reference values recommandées for the santand could lead to a degradation of the data center microprocessors. He a également eté constaté that visit concentrations in the airyourient more élevés several days after the demolition.
Discover other projects
Study of aeraulic comfort – Middle school
Wind comfort study – Rooftop
Wind impacts on high-rise buildings: Tours Olympiades in Paris
Comfort – Rooftop of a palace – Casablanca
Tour Liberté – La Défense
Impact of wind on a solar power plant
Cooling towers – ICPE
Pedestrian comfort study – La Défense
Confort au Vent – PSG training center
Wind study – La Défense
Fine particle capture in a metro station
Sharaan by Jean Nouvel resort
Air coolers – Critical study – Heat wave
Fine dust measurements
Balenciaga – Wind potential

