Home » VOC treatment process improvement
VOC treatment process improvement
Study of the homogeneity of an aeraulic mixture in a collection network
EOLIOS’ in-depth study analyzed the homogeneity of the VOC + air mixture leaving a cacth tank.
VOC treatment process improvement
Year
2024
Customer
NC
Location
France
Typology
Laboratory - Industrial Process
Continue navigation :
Our other projects :
Latest news :
Presentation of the VOC treatment system
In the new collection network for volatile organic compounds (VOCs), each workshop will be directly connected to a collector called a “clarinette”, located just before the catch tank. This will enable the neutral pressure point to be located close to the VOC collection clarinet, facilitating aeraulic balancing of the network.
At the clarinet outlet and before entering the catch tank, there will be a fitting equipped with stove tails. This connection will enable the VOC flow to be directed to the existing VOC treatment plant, which is a boiler room, as a back-up solution in the event of the thermal oxidizer not being used.
A compensating air inlet in the clarinet will increase the total flow rate to the desired level, which corresponds to the nominal operating flow rate of the thermal oxidizer considered at this stage of the study. The air supply to the catch tank will be used to keep the lower explosive limit (LEL) below the maximum value permitted by the thermal oxidizer supplier.
A second catch tank will be positioned just before the thermal oxidizer to collect the condensates present in the last part of the VOC collector.
All VOC data, unless otherwise stated, are based on measurements taken over a 7-week period.
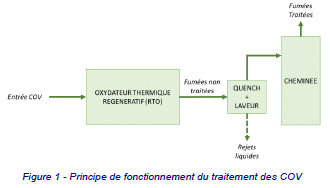
During the feasibility study, an analysis of the most effective VOC treatment techniques was carried out, and the choice fell on the Regenerative Thermal Oxidizer (RTO). RTO is a technology used to treat VOCs by incinerating them at high temperature. The operating principle of the RTO is shown in the figure below.
Volatile organic compounds (VOCs)
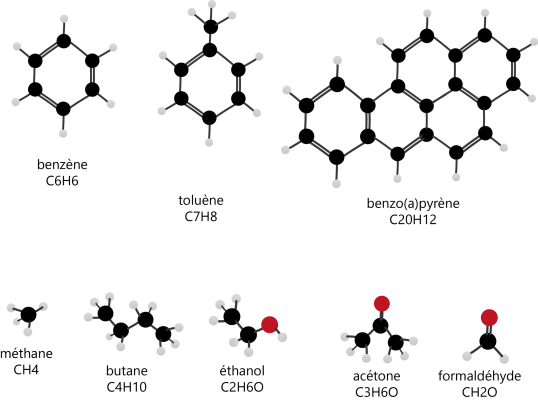
Volatile organic compounds (VOCs) are carbon-based chemical substances that vaporize easily at room temperature. They are generally produced by industrial processes, fossil fuel combustion, solvents, cleaning products, paints and cosmetics.
VOCs can react with other substances in the atmosphere to form ozone and fine particles, leading to air quality and public health problems. Some VOCs are also considered persistent organic pollutants (POPs) due to their persistent nature and potential to bioaccumulate in the environment.
Explosive hazards and LEL
Definitions of boundary conditions
The explosive risks associated with volatile organic compounds (VOCs) are mainly linked to their flammability. VOCs have a low boiling point, which means they evaporate easily and can form flammable mixtures in the air. When these mixtures reach a sufficiently high concentration and a source of ignition is present, an explosion can occur.
Some VOCs, such as ethane, propane and butane, are particularly flammable and can form explosive mixtures, even at low concentrations in the air. Other VOCs, such as organic solvents, can also present an explosive risk if present in significant quantities and if conditions are conducive to the formation of a flammable mixture.
VOCs can also present a risk of exceeding Lower Explosive Limits (LELs). LELs are the minimum atmospheric concentrations of VOCs required to form an explosive mixture. If the concentration of VOCs in air exceeds the LEL, the risk of explosion increases considerably.
VOC dilution
Dilution of the volatile organic compound (VOC) flow can be envisaged by using fresh air when peaks in the lower explosive limit (LEL) percentage are detected by the LEL sensors. An initial estimate of the flow rate required to reduce the percentage LEL has been made.
Concentrations and estimated LEL values for N=10 were recalculated for different flow rates. The following figure illustrates the impact of dilution on the percentage of cases where the LEL exceeds 17% and 25%.
By increasing the flow rate from 10,000 Nm3/h to 11,000 Nm3/h, cases where the LEL percentage exceeds 25% decrease from 0.5% to 0.3%. Similarly, by increasing the flow rate from 10,000 Nm3/h to 13,000 Nm3/h, cases where the LEL exceeds 25% decrease from 0.5% to 0.1%. Where the LEL exceeds 17%, a flow rate of 13,000 Nm3/h reduces the number of cases from around 5% to 1%.
CFD modeling of VOC dilution
Definitions of boundary conditions
To solve the partial differential equations, you need to specify the boundary conditions for the calculation. The boundary conditions will have been defined using information collected from the project manager. The system’s input points will be accurately modeled. Each air discharge point will be modeled individually (subject to model convergence, see calculation method).
When defining the boundary conditions, it is important to take into account the stability of the calculation: the equations are solved approximately, in several stages, and it is important to get closer to the solution at each stage (see calculation method).
For systems, the boundary conditions giving the most stable calculation are :
- an input on which a speed or flow rate is imposed;
- an outlet to which a pressure or flow rate is applied.
These are the most common boundary conditions applied to the resolution of studies. The implementation of project-specific boundary conditions will be the subject of a detailed study at the start of the assignment. In the event of non-convergence of the model, EOLIOS will adapt/reduce the geometry, ensuring that all aeraulic aspects having an impact on the study are taken into account.
Mesh principle
To solve the partial differential equations, you need to specify the boundary conditions for the calculation. The boundary conditions will have been defined using information collected from the project manager. The system’s input points will be accurately modeled. Each supply point will be modeled individually (subject to model convergence, see calculation method).
When defining the boundary conditions, it is important to take into account the stability of the calculation: the equations are solved approximately, in several stages, and it is important to get closer to the solution at each stage (see calculation method).
For systems, the boundary conditions giving the most stable calculation are :
- an input on which a speed or flow rate is imposed;
- an outlet to which a pressure or flow rate is applied.
These are the most common boundary conditions applied to the resolution of studies. The implementation of project-specific boundary conditions will be the subject of a detailed study at the start of the assignment. In the event of non-convergence of the model, EOLIOS will adapt/reduce the geometry, ensuring that all aeraulic aspects having an impact on the study are taken into account.
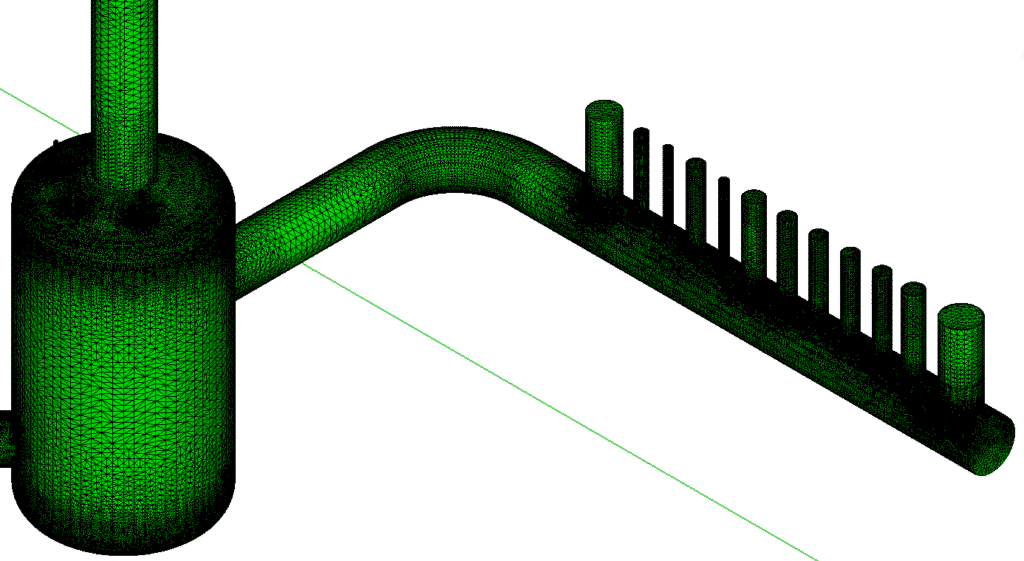
The mesh is generated automatically from the model geometry and boundary conditions, using algorithms that define the optimal convergence solution.
The mesh produced is of the hybrid type. The elements of this type of mesh are generated arbitrarily, with no constraints on their arrangement, enabling complex geometry to be generated while maintaining good element quality. The mesh generated combines a mixture of elements of different types: tetrahedral, prismatic or pyramidal in 3D. It combines the advantages of structured and unstructured meshes.
In each of these volumes, the conservation equations are expressed as algebraic equations. This set of finite volumes is referred to as the mesh.
Modeling volatile compounds
This section describes the method used to study the diffusion of volatile compounds in order to investigate the homogeneity of the mixture at the outlet.
When the concentration of particles in a medium varies from one point to another, these particles move from areas where their concentration is high to areas where their concentration is low: particles are said to diffuse in the medium.
To study the phenomenon of VOC diffusion, we use a CFD model that gives us approximate results for the areas most affected.
The diffusion model is based on Fick’s law and the characterization by a coefficient D of the diffusion of gases in the air. The diffusion coefficient D depends on the nature of the particles which diffuse and those of the medium in which these particles move. In air, gases do not follow the exact path of the air, but diffuse from the source into the air according to aeraulic trends.
CFD simulation of a catch tank (VOC)
Air velocity study
The figures show velocity planes at various locations (at the catch tank inlet, at the catch tank outlet, at the measuring point, and two planes inside the catch tank). These planes illustrate a non-uniform velocity distribution, particularly pronounced at the catch tank inlet and less pronounced at the measuring point.
These non-homogeneous speed variations are attributed to the bends in the ducts, which create long-distance recirculation zones. The recirculation loops created by these bends encourage flow mixing.
Velocity maps inside the catch tank reveal the presence of three main recirculation zones (circled in black). The first recirculation zone, located along the axis of the half pipe, is the largest of the three zones identified. Mixing occurs mainly in this zone. Overall, velocity amplitudes inside the catch tank are relatively low, which is beneficial for efficient mixing.
VOC dilution study
The drawings show the distribution of VOCs at various locations, including the inlet and outlet of the catch tank, the outlet of the first bend downstream of the catch tank, and the measuring point.
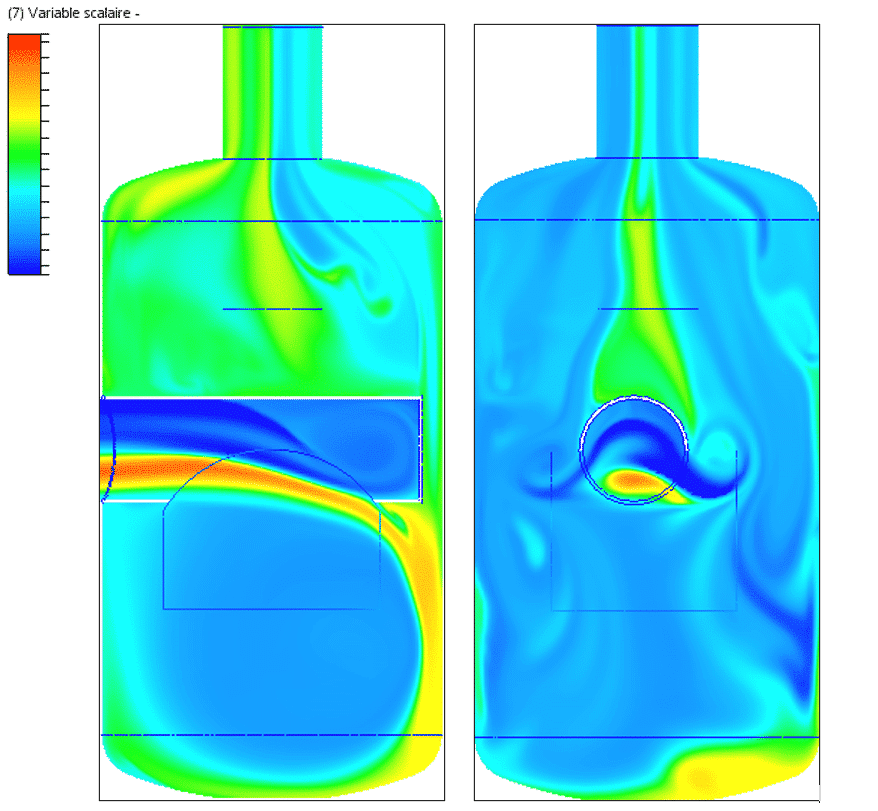
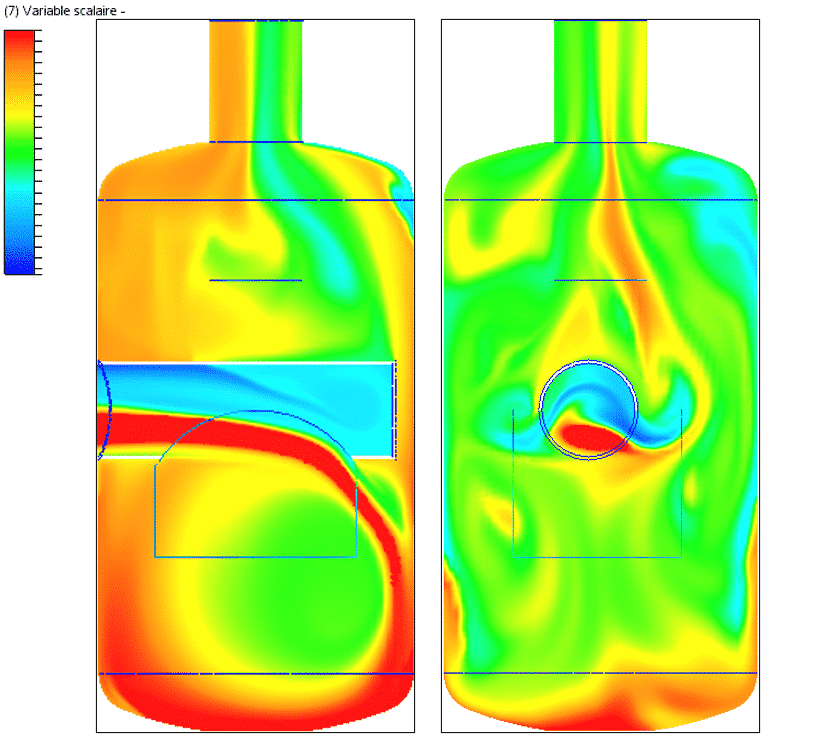
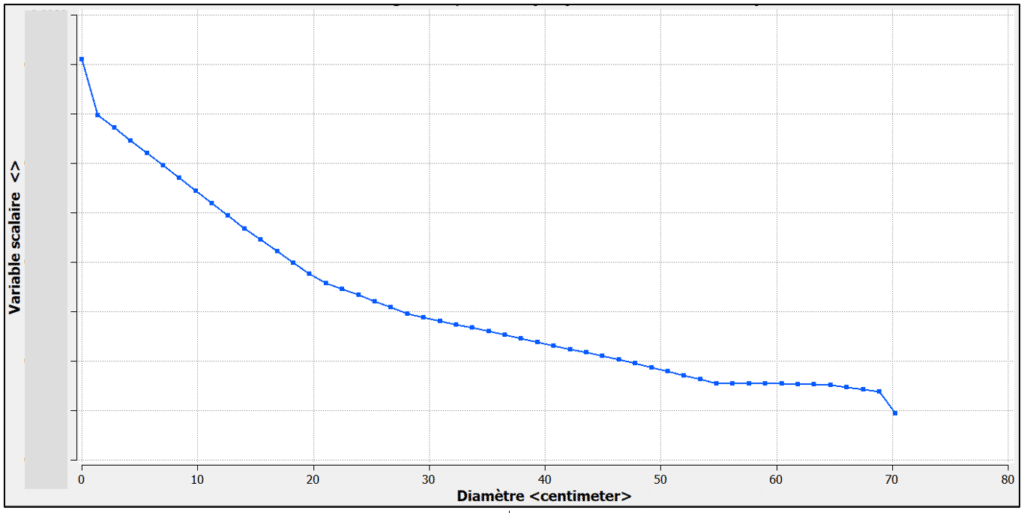
These drawings show that the distribution of VOCs at the catch tank outlet is more uniform than at the inlet. Modification of the diffusion coefficient at 10°C results in improved homogeneity of the mixture at the catch tank outlet. Initially, the concentration disparity at the inlet is at least 0.03 (i.e. 3%), but it decreases to 0.016 (i.e. 1.6%) upon leaving the catch tank.
Passing through the two bends, this disparity is further reduced to 0.00035 (i.e. 0.035%) at the measuring point, as shown in the following figure.
Continue on this topic
Discover other projects
Simulation of saturated vapour capture on a continuous casting line
Simulation of saturated vapour capture on a continuous casting line
Radiation and ventilation study of an industrial ingot mould
Sizing – Chimney – Laboratory
Smoke treatment system – CO2
VOC treatment process improvement
Sizing an industrial chimney – Furnace
Stratification of a thermal storage tank
Generator sets – GE1
Simulation of saturated vapour capture on a continuous casting line
Simulation of saturated vapour capture on a continuous casting line
Radiation and ventilation study of an industrial ingot mould
Study of natural ventilation – Steelworks
Air quality improvement – Plant
Sizing – Chimney – Laboratory
High-temperature process plant
Natural ventilation – Metallurgy

