CFD simulation of the aerodynamic phenomena of a peloton of cyclists
Home » Air & Wind » CFD simulation of the aerodynamic phenomena of a peloton of cyclists
Impact of rider position variations on aerodynamic interactions in the peloton
The performance of cyclists in a peloton is largely influenced by the fluid dynamics developing around them. In racing, cyclists form compact groups to take advantage of thesuction effect and reduce air resistance, which can significantly improve their energy efficiency and overall performance. This effect is particularly crucial in high-level competitions, where the slightest energy saving can mean the difference between victory and defeat.
Our Data Center projects: Air & Wind
CFD modeling of aerodynamic interactions in a group of racers
The performance of cyclists in a peloton is largely influenced by the fluid dynamics developing around them.
In racing, cyclists form compact groups to take advantage of thesuction effect and reduce air resistance, which can significantly improve their energy efficiency and overall performance. This effect is particularly crucial in high-level competitions, where the slightest energy saving can mean the difference between victory and defeat.
Understanding the fluid dynamics around a peloton of cyclists has major practical implications. Peloton formations and the relative positions of cyclists directly influence the distribution of aerodynamic drag, thus impacting individual energy expenditure. For example, cyclists at the front of the peloton generally experience greater air resistance, while those behind benefit from a significant reduction in drag.
By optimizing peloton formations and exploiting race strategies based on fluid dynamics, cycling teams can maximize collective efficiency. This is particularly relevant in stage races, team time trials and criterium races, where energy management is essential to maintain high performance over long distances.
However, despite its importance, fluid dynamics around cycling pelotons is complex and difficult to study empirically due to the many variables involved, such as wind speed, wind direction, rider position and aerodynamic interactions.
This is where CFD (Computational Fluid Dynamics) simulations become an invaluable tool. They enable us to model andanalyze these phenomena with greater precision and flexibility, without the logistical constraints and costs of wind tunnel or field testing.
The aim of this study is to take advantage of CFD simulations to further our understanding of fluid dynamics within a peloton of cyclists. By analyzing different configurations and positions of cyclists, we aim to identify optimal formations to minimize aerodynamic drag and maximize energy efficiency.
CFD simulation methodology for aerodynamic analysis of a cycling peloton
CFD simulation
To study fluid dynamics around a peloton of cyclists, we used CFD(Computational Fluid Dynamics) simulation, a powerful technique for modeling air flows in precise detail. CFD is a numerical method for analyzing fluid movements by solving partial differential equations.
It offers the advantage of being able to easily explore various configurations and quantify the aerodynamic forces exerted on each individual rider. By comparing these forces, we can identify the most effective positions and formations in terms of drag reduction.
CFD simulation is a powerful method for studying airflow around a peloton of cyclists, offering the ability toprecisely analyze aerodynamic forces. However, its limitations in terms of computing time and resources can be restrictive, particularly with a maximum of one week’s computing time and the absence of a data center. To overcome these limitations, compromises such as theoptimization of simulation parameters, like the use of an adaptive mesh (detailed at the end of the article), were necessary to strike a balance between accuracy and efficiency in our studies.
CFD study parameters
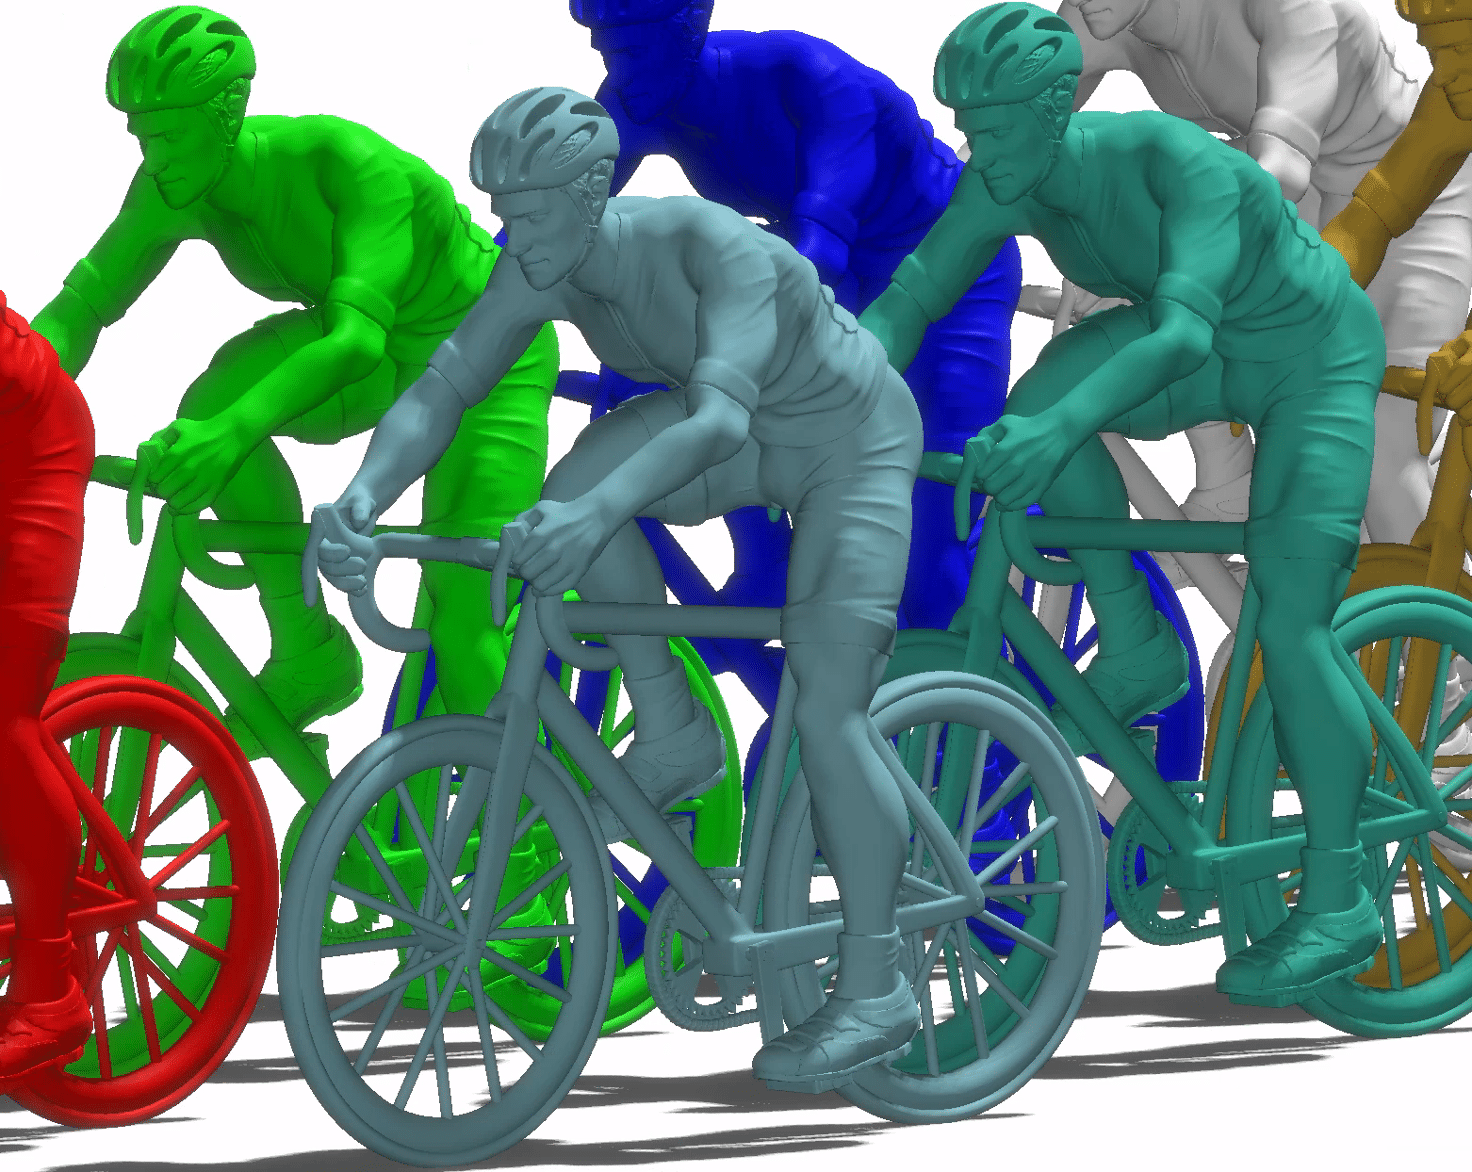
To ensure an accurate comparison of the effects of aerodynamic forces inside and outside the peloton, we standardized the geometry of each cyclist in our study. By using identical models for each cyclist, we have eliminated variables related to individual differences, allowing us to focus solely on theimpact of positions and formations within the peloton.
This geometric uniformity ensures that any variations observed in aerodynamic forces are due exclusively to interactions between the cyclists andtheir relative arrangement, providing more reliable and relevant results for studying positions favorable to drag reduction.
To carry out the simulation of your peloton of cyclistsan advanced simulation model, the Wall-Modeled Large Eddy Simulation (WMLES), was used. This high fidelity enables capture the details of turbulent flows by automatically adapting the resolution near wallswhile taking into account pressure gradients responsible for flow separationwhich are crucial for aerodynamic analyses. Visit WMLES uses a viscosity model called Wall-Adapting Local Eddy (WALE), which ensures consistent local viscosity and precise behavior close to walls. This method makes it possible to dynamically refine the wake as the flow develops, guaranteeing accurate and stable accurate and stable modeling of complex aerodynamic phenomena surrounding the cyclists.
Several studies have already examined the fluid dynamics around a peloton of cyclists, such as The Peloton Project by Professor Bert Blocken of Eindhoven University of Technology. However, these studies often overlook the non-uniform nature of the cyclists’ arrangement within the peloton. In other words, cyclists are not arranged in a regular or Cartesian fashion, aligned with one another. Consequently, it is necessary to study a more realistic configuration, taking into account this variability in cyclist arrangement.
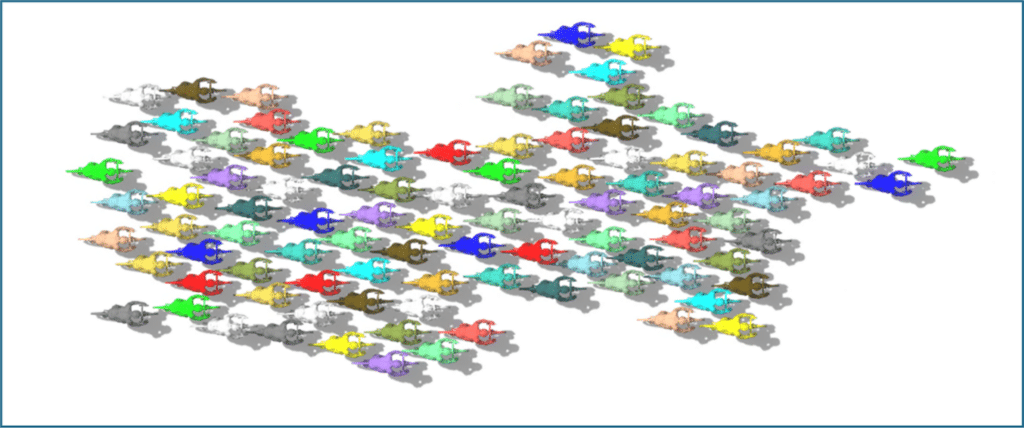
The configuration studied is that of a peloton of 100 cyclists arranged to simulate a real race on a wide road. This approach makes it possible toanalyze variations in aerodynamic forces under conditions closer to reality, as opposed to rigid, aligned formations which would be less representative of race dynamics.
Measuring drag forces
Issues
Measuring drag forces is crucial in the world of cycling, as it quantifies the air resistance that each cyclist must overcome while riding. This aerodynamic resistance is one of the main factors limiting performance, especially at high speeds. In racing, reducing drag means significant energy savings, enabling cyclists to maintain higher speeds with less effort, which is essential for optimum performance over long distances.
Aerodynamic drag: how does air influence performance?
Aerodynamic drag, or air resistance, is a force determined by several factors and has a significant influence on a cyclist’s performance. This force results from theinteraction between the cyclist (and his bike) and themoving air around him. It depends on the density of the ambient air, the rider’s speed, the frontal area exposed to the airflow, and the drag coefficient (Cd or Cx), which reflects theoverall aerodynamics of the rider-bike configuration.
Quantitatively speaking, aerodynamic drag is proportional to the product of air density, the square of the rider’s speed, and the frontal area of the rider. In other words, the cyclist must literally “push” and set in motion the entire volume of air through which he or she passes. Consequently, reducing air density or frontal area can significantly reduce this drag.
A cyclist who wants to reduce drag can reduce his frontal area by adopting a more prone position on the bike, a strategy commonly used by professionals in time trials. The drag coefficient dependsnot only on the aerodynamic shape of the cyclist and his bike, but also on the details of the airflow around them.
Research shows that the cyclist’s movement creates an overpressure of air in front of him and a depression behind him, both of which contribute to drag. What’s more, the cyclist carries several meters of moving air in his wake, further complicating aerodynamic interactions for riders downstream.
For cyclists in a peloton, the effect of drag is modulated by their relative position in the group. For a headwind, riding in single file, for example, reduces the drag experienced by the following cyclists by reducing overpressure and underpressure. The effect is more pronounced for riders behind, and also depends on the distance between the wheels and the aerodynamic position adopted.
Velocity and pressure distribution around cyclists using CFD simulation
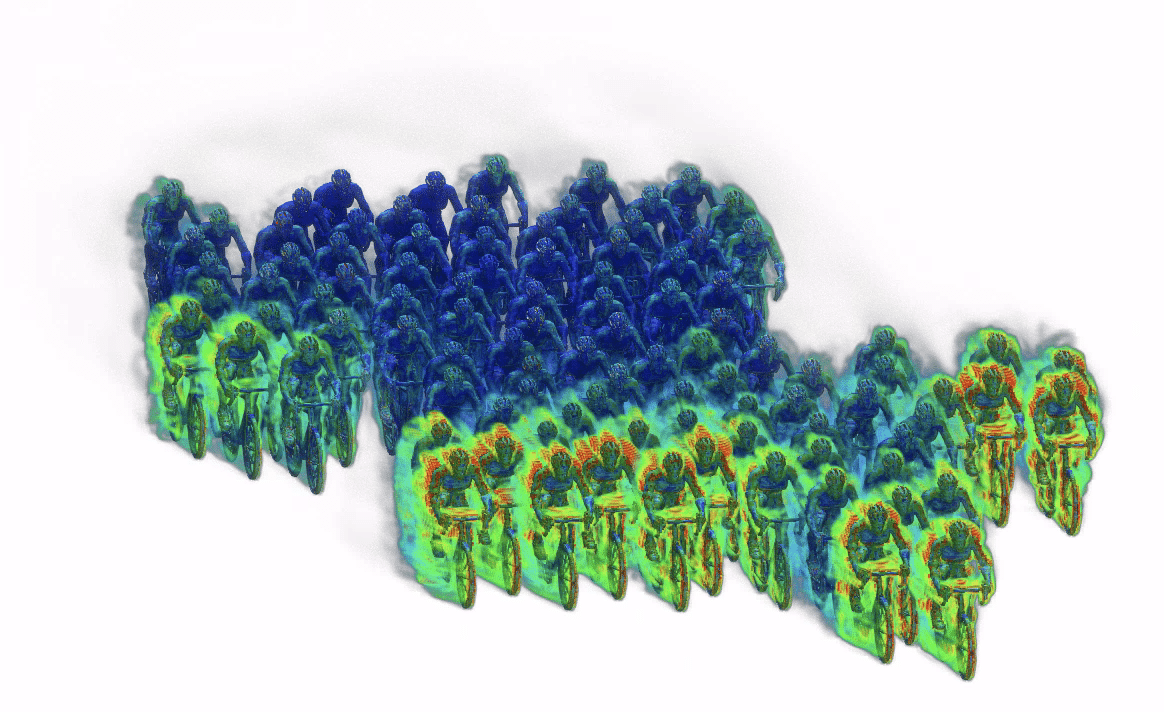
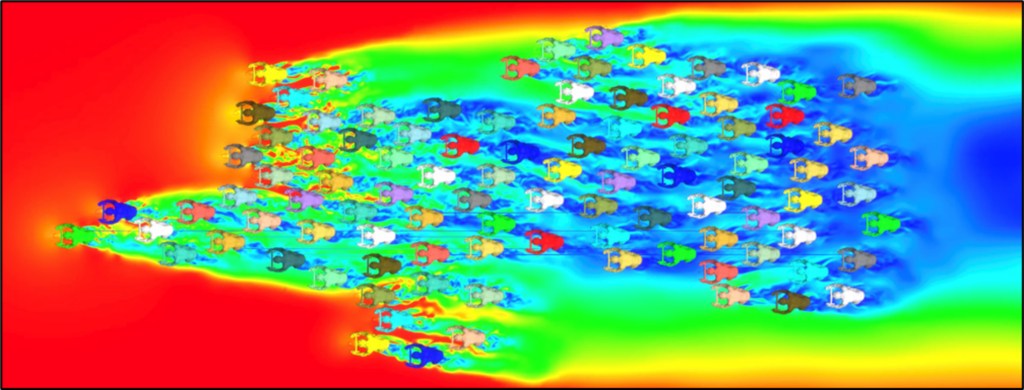
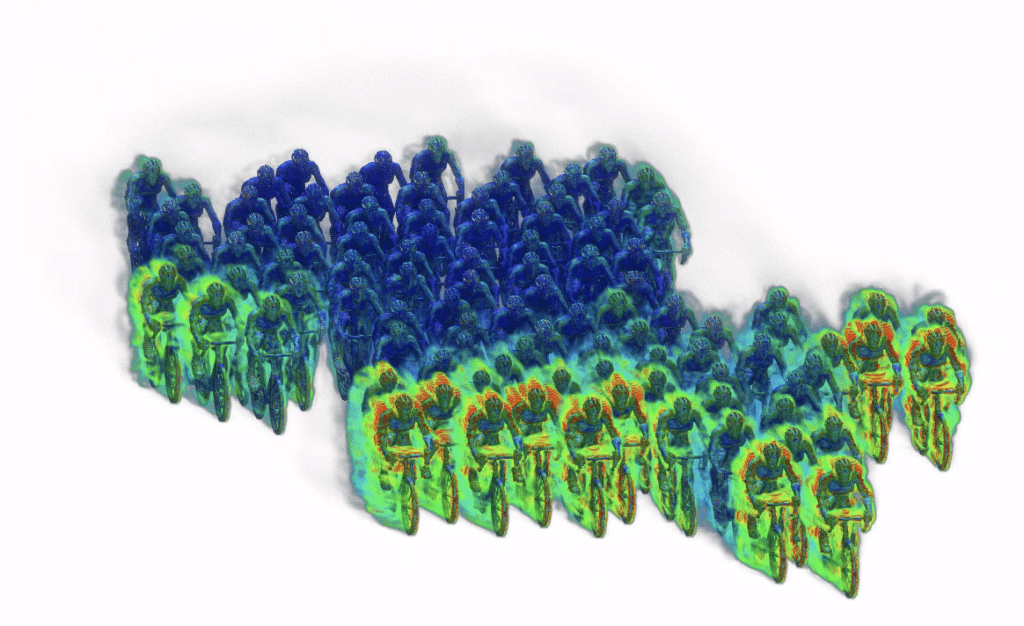
The simulation displays the speed distribution planes around the cyclists. Since the force of drag is proportional to the square of the speed, the most favorable areas of the peloton can already be identified.
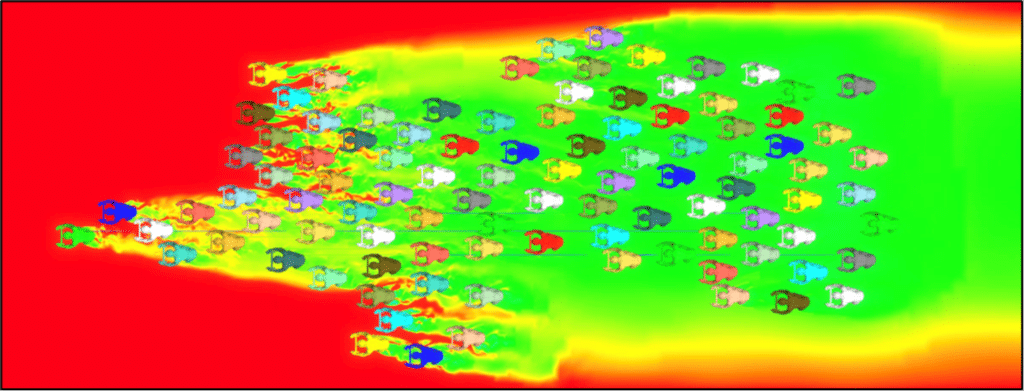
The apparent air speed is 15 m/s ( 54 km/h) for the cyclist at the front of the peloton, so he’ll feel more drag than cyclists within the peloton. In fact, we can see that effective speeds within the peloton are lower, thus reducing drag on the cyclists within it. The two figures below give a clearer idea of this, with air velocities and pressure distributions as seen from above the peloton.
The figure above shows that cyclists at the front of the peloton encounter higher air speeds. In contrast, cyclists further back and inside the peloton encounter lower air speeds. In effect, cyclists at the front act as windbreaks, protecting cyclists at the back of the peloton by reducing the air resistance they encounter. This has a direct impact on the drag force felt by each individual cyclist. Indeed, as this force is proportional to the square of speed, it’s safe to assume that the drag felt by riders at the front of the pack will be greater than that felt by riders at the back.
It is also said that cyclists in the heart of the peloton benefit from the suction generated by cyclists at the front of the pack. This can be seen in the pressure map below. By riding in the wake of the frontrunners, the peloton riders benefit from the low pressure behind them, which reduces the overpressure they create themselves. As a result, aerodynamic drag is considerably reduced for these cyclists. This suction effect enables cyclists to maintain high speeds with less effort, taking advantage of reduced air resistance.
In practice, CFD simulation can be used tooptimize cyclists’ positions, choose more aerodynamic equipment and develop effective racing strategies. In time trial techniques, for example, cyclists can benefit from these simulations by adjusting their position on the bike to maximize aerodynamics.
CFD simulation helps to determine the optimum position, often by adopting a lower, more elongated posture to minimize the frontal area exposed to the wind. In addition, cyclists can use bikes specially designed for time trials, with streamlined frames and solid wheels that further reduce drag. In the wind tunnel, cyclists test different equipment configurations, such as aerodynamic helmets and tight-fitting racing suits, to select those offering the least air resistance.
CFD simulation has one advantage over wind tunnel testing: it saves time and money. Thanks to adjustments based on simulation data, cyclists can save precious seconds, or even minutes, on their overall performance. Cycling teams also use simulation and wind tunnel data to form pelotons strategically, maximizing thesuction effect and reducing collective drag.
Measuring drag on CFD simulation
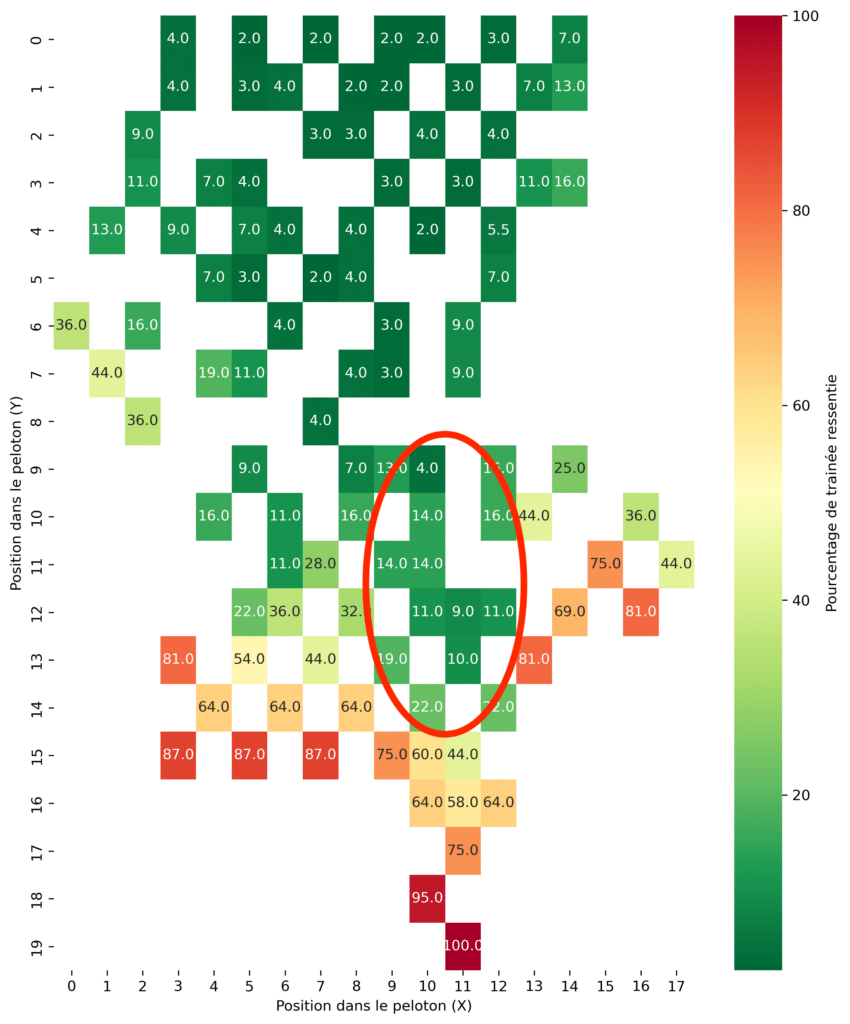
In the following, we evaluated the drag forces on each individual cyclist and therefore the most favorable positions in the peloton. The figure below summarizes the percentage of drag felt by a rider compared with the drag felt by the rider at the front of the pack (who feels the maximum drag associated with the 100% value).
In concrete terms, the map shows the percentage of drag felt by each cyclist in the peloton, calculated as a function of the maximum drag felt by the leading cyclist. Thus, cyclists in more favorable positions within the peloton will benefit from lower drag percentages, indicating a significant reduction in air resistance thanks to the protection offered by the other cyclists. Cyclists in the middle of the peloton have to exert half as much effort as those at the front.
Cyclist placement strategy to minimize drag
Generally speaking, all cyclists in the peloton experience less drag than the leading cyclist. The further back a rider is in the peloton, the less drag he or she is exposed to. This trend also applies to cyclists in the middle of the peloton, who experience less drag than those on the periphery. The figure above shows that the zone delimited by the red circle is the most advantageous for a cyclist at the start of the race. In this zone, cyclists feel only 10% to 20% of the drag experienced by the leader, while remaining close to the head of the race, resulting in considerable energy savings at the start of the race.
However, the choice of place in the peloton is not based solely on energy considerations. The further back a cyclist is in the peloton, the more vulnerable he or she is to accordion effects caused by acceleration at the front, or to possible crashes. This is why the leaders of the Tour de France prefer to stay in the front ranks, surrounded by their team-mates. Drag reduction is still very significant, but they can more easily react to sudden acceleration by their rivals.
Vorticity field
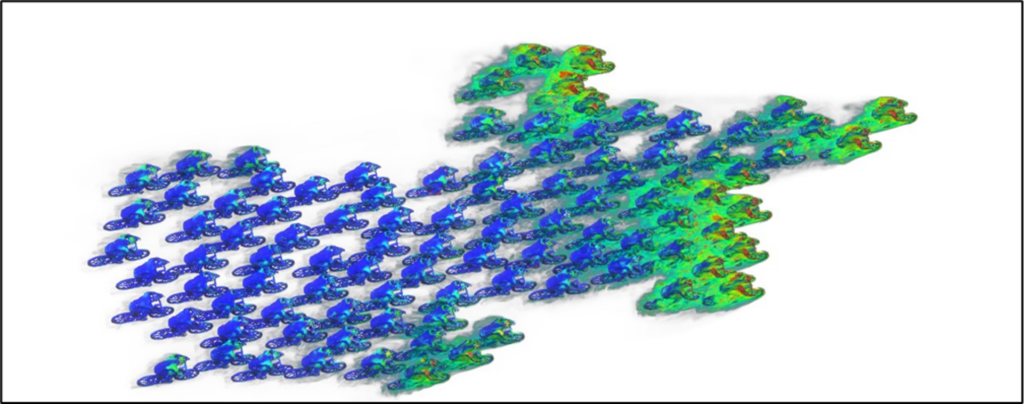
Vorticity is a measure of the rotation of a fluid around a local axis. When an object, such as a cyclist on a bicycle, moves through a fluid such as air, it naturally disturbs the flow of that fluid.
This disturbance results in the formation of vortices, areas where the speed and direction of the fluid are altered. These vortices generate vorticity, a quantity that characterizes theintensity and location of these rotations.
The volumetric vorticity field below, we can see that it’s the bikes bikes at the front of the pack disturb the flow the most, resulting in higher higher drag on them.
The edge phenomenon in cycling
Fan formation: a collaborative strategy to counter the wind and stay in the race
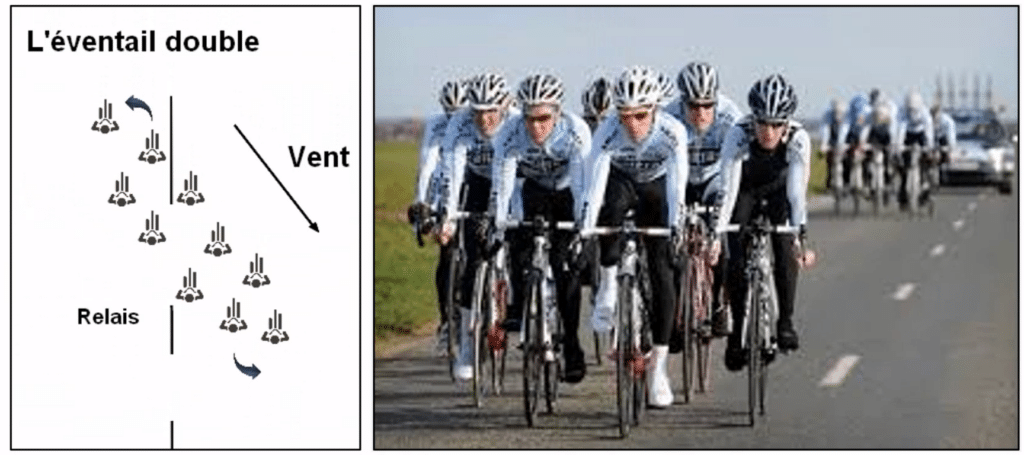
A complex but effective strategy for protecting yourself from side winds is to form fans. A rider will position himself slightly behind and to the side of the rider producing the effort, sheltering himself from the wind. The stronger and more sideways the wind, the more the rider moves sideways to benefit from this protection.
When a rider finds himself isolated and exposed to the wind, he is said to be“in the kerb” or to have been“kerbed”. For this rider, the effort becomes considerably more difficult, often to the point of not being able to keep up with the peloton.
The key to this strategy against the wind is to form fans. The leading rider positions himself on the side from which the wind is blowing, to protect those behind him. For example, if the wind is coming from the left, the leader positions himself at left of the road. After taking his relayhe eases off, letting his team-mates benefit from his shelter as he drops back to the rear of the group before resuming his position behind the last runner, sheltered from the wind. sheltered from the wind. This process repeats itself, ensuring continuous relay rotation and optimum optimum wind protection.
Surviving the edge: the subtle art of sheltering from the wind in a group
There are two types of fan: single and double. The single fan, organized in a single file, is used for small groups, such as a breakaway of less than eight riders or a team time trial. The rider in the lead eases off after his or her relay, stays in contact with the rising line, bypasses the last rider and quickly moves back to safety.
The double fan, on the other hand, is more efficient and consists of two lines: one downstream and one upstream. The descending line, made up of the riders who have taken over, positions itself on the windward side, while the ascending line, sheltered by the descending line, prepares to take over. This formation ensures continuous protection for all runners, as they are always sheltered by the descending file or by the runner in front of them.
Isolated riders: the key to dropping out of the peloton
The double fan formation requires at least ten riders to be in place. In competition, a team can tighten the fan by placing a strong rider close to the edge of the road, on the opposite side to the wind, thus reducing the number of protected riders and increasing the difficulty for opponents. When the crosswind isintense, this technique can fragment the peloton, creating spectacular and decisive edges in the race. Indeed, cyclists who fail to insert themselves correctly into the fans find themselves directly exposed to the wind, suffering a drastic increase in aerodynamic drag. This increase in drag results from the break-up of the smooth, continuous airflow around the cyclists, creating turbulence and increased resistance.
Riders sheltered in the fan benefit from a significant reduction in drag thanks to thewake effect and lateral protection offered by their team-mates. Isolated riders, on the other hand, have to make a much greater effort to maintain their speed, which can lead to them dropping out of the pack. This imbalance in the distribution of aerodynamic forces can causethe peloton to split into several distinct groups, making the edging phenomenon not only tactically crucial but also spectacular. This aerodynamic aspect has led to leaders losing Tours de France.
CFD study of fan-shaped cyclists
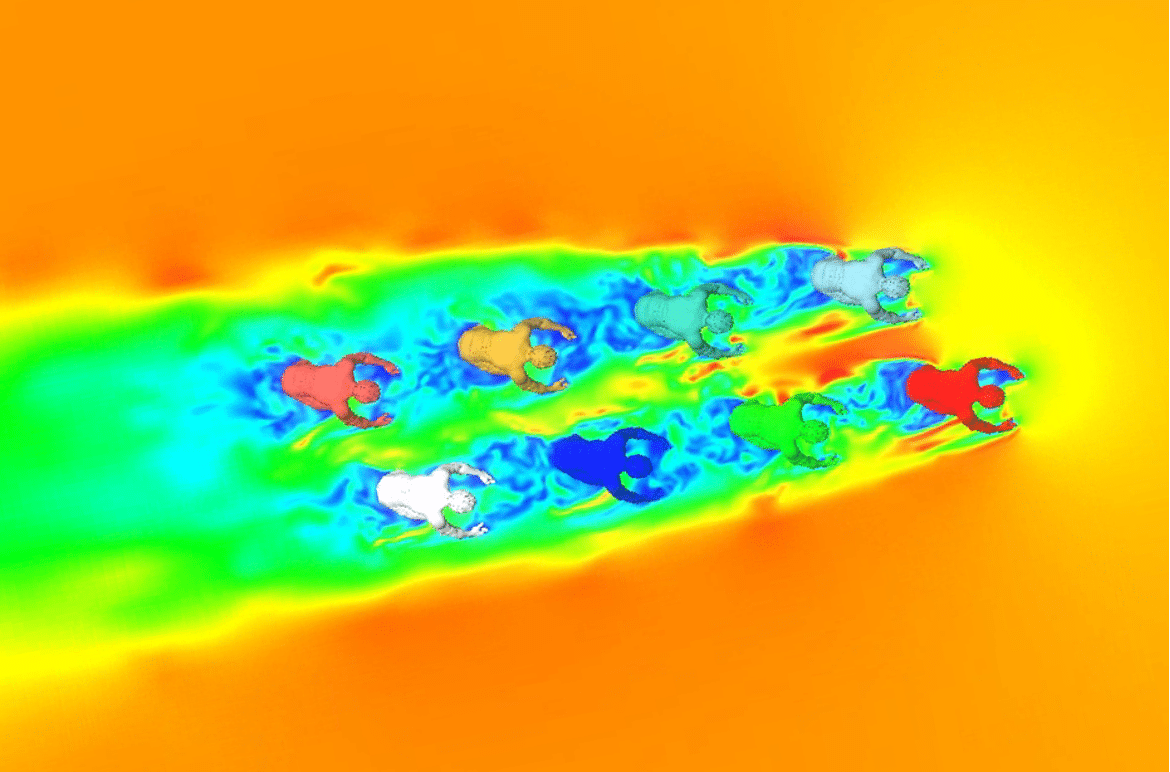
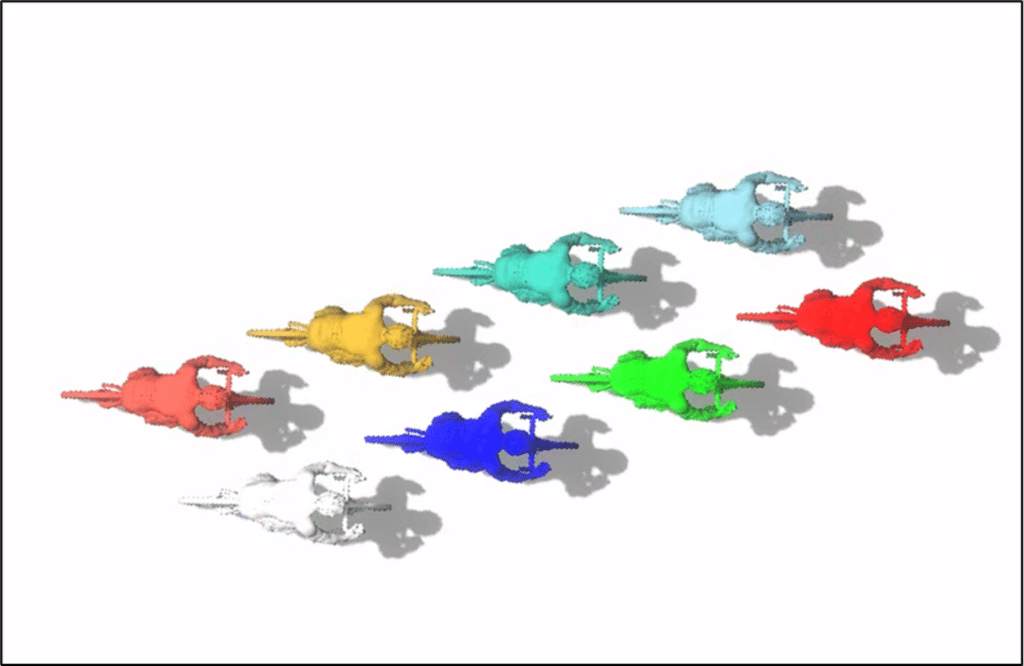
Eolios has studied the double fan configuration of 8 cyclists when a side wind appears during a race. The aim of this study is to use CFD to confirm theeffectiveness of the fan configuration in this type of situation.
The 3D model of the cyclists is the same as above, and the configuration studied is shown in the figure below.
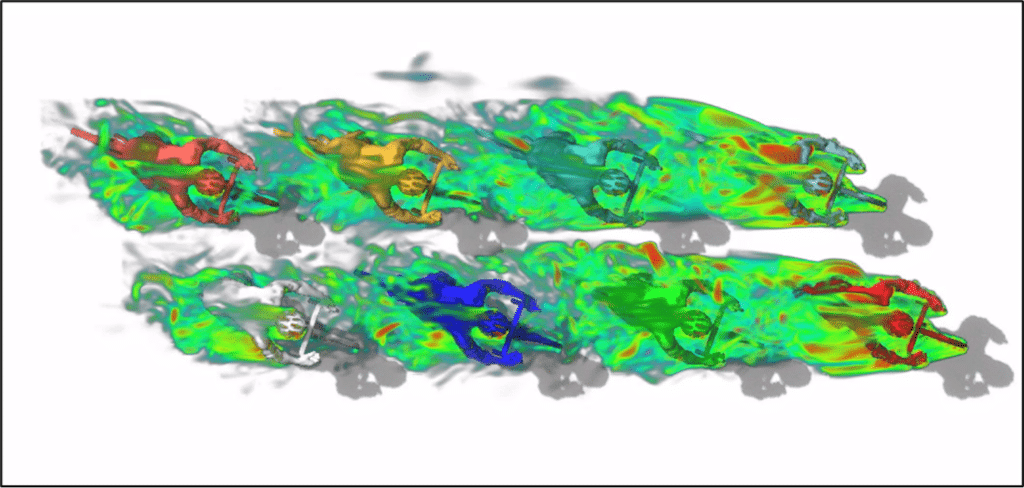
The figure below shows the distribution of air velocities around the cyclists. Air velocities at the level of the protected cyclists are lower. As in the case of the classic peloton, protected cyclists will experience much less drag.
CFD simulation of the aerodynamics of fan-shaped cyclists
Calculations of the drag forces show that the 6 protected riders feel on average 30% of the total drag feltby each of the two leading riders. This 70% reduction in drag proves that the double fan system is effective in crosswind conditions.
By displaying the volumetric vorticity field, we can see that, as in the case of the classic peloton, the leading cyclists disturb the airflow the most and are the most impacted by it.
Volumetric field of vorticity around fan-shaped cyclists
Performance optimization and aerodynamics: the impact of CFD simulation in competitive cycling
This study of CFD simulation applied to a peloton of cyclists is a deliberate move on the part ofEOLIOS to illustrate the technological advances and practical applications of CFD in competitive cycling. By analyzing crucial aspects such as aerodynamic drag and the strategic positions of riders (with edge phenomena, for example), we were able to demonstrate how these tools can optimize performance and offer significant competitive advantages at prestigious events such as the Tour de France.
With this initiative, EOLIOS aims not only to share with the general public and cycling enthusiasts the possibilities offered by CFD simulation, but also to encourage a deeper understanding of the scientific and technological factors that influence the sport. By contributing our expertise and innovations in this field, we hope to contribute to thecontinuous improvement of athlete performance and theadvancement of knowledge inthe competitive cycling sector.
EOLIOS hopes that this study will inspire further CFD research and applications in various sporting fields and beyond.
Synthesis of CFD simulations of a peloton of Tour de France cyclists
Air & Vent: on the same subject
CFD simulation of drag: advanced calculation to improve aerodynamics
Impact of wind on a solar power plant
Pressure loss and hydraulic resistance
Legionnaires’ disease and cooling towers
Pedestrian comfort criteria and mapping

CFD study of extreme wind conditions on solar panels and power plants

Thermal draft effect

CFD simulation: An alternative to wind tunnel testing
Pressure study


