Simulation and optimization of thermal plumes – Data Center
Simulation et optimisation des panaches thermiques - Data Center
Year
2025
Customer
NC
Location
Paris
Typology
Data Center
Home » Data Center » External CFD simulation for data center » Simulation and optimization of thermal plumes – Data Center
Thermo-aerodynamic optimization of a data center technical area
General issues and thermo-aerodynamic context
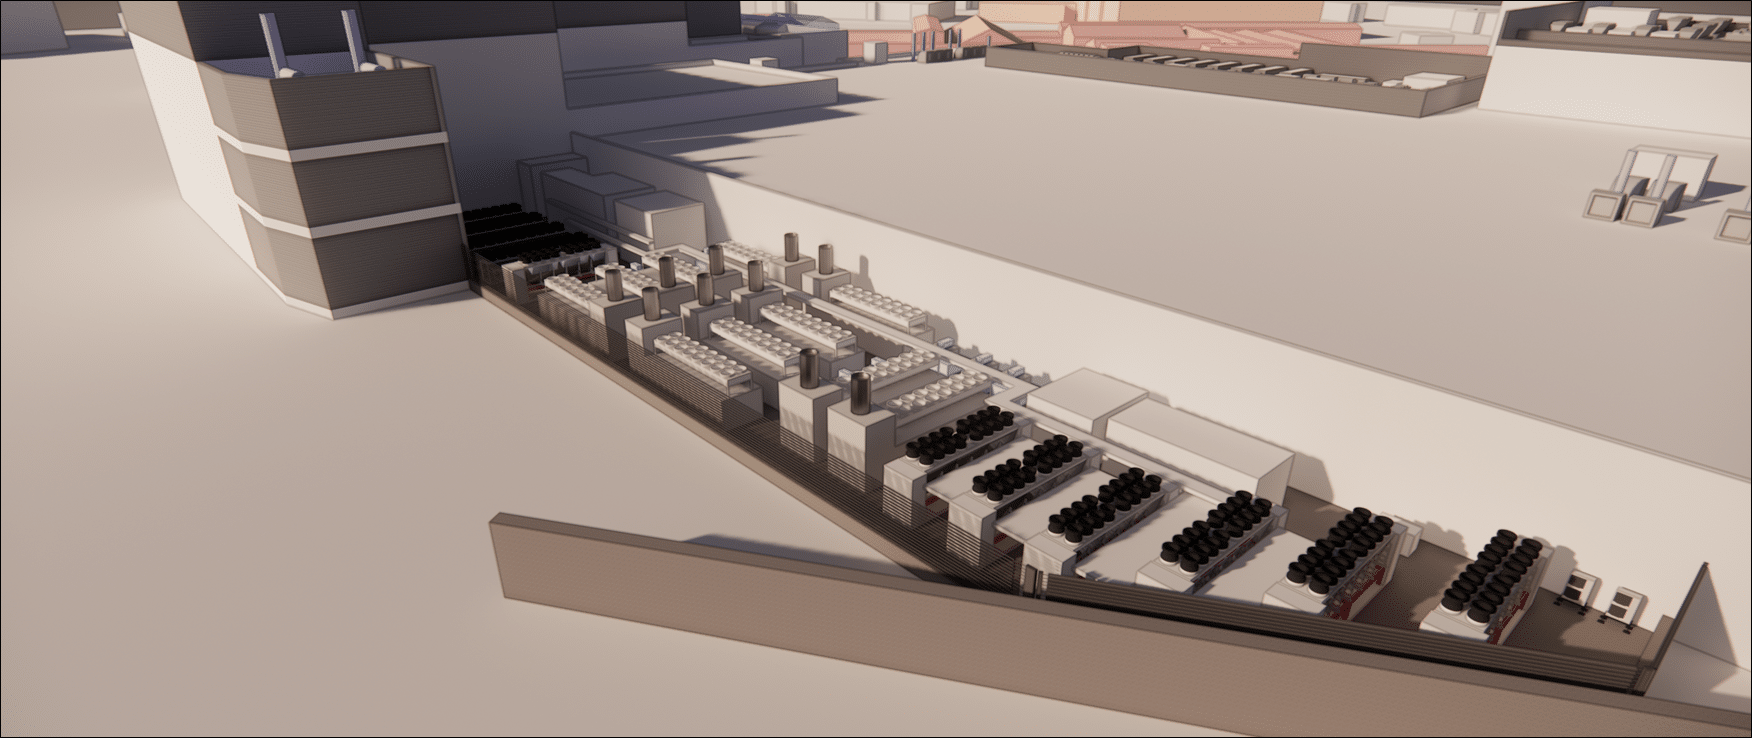
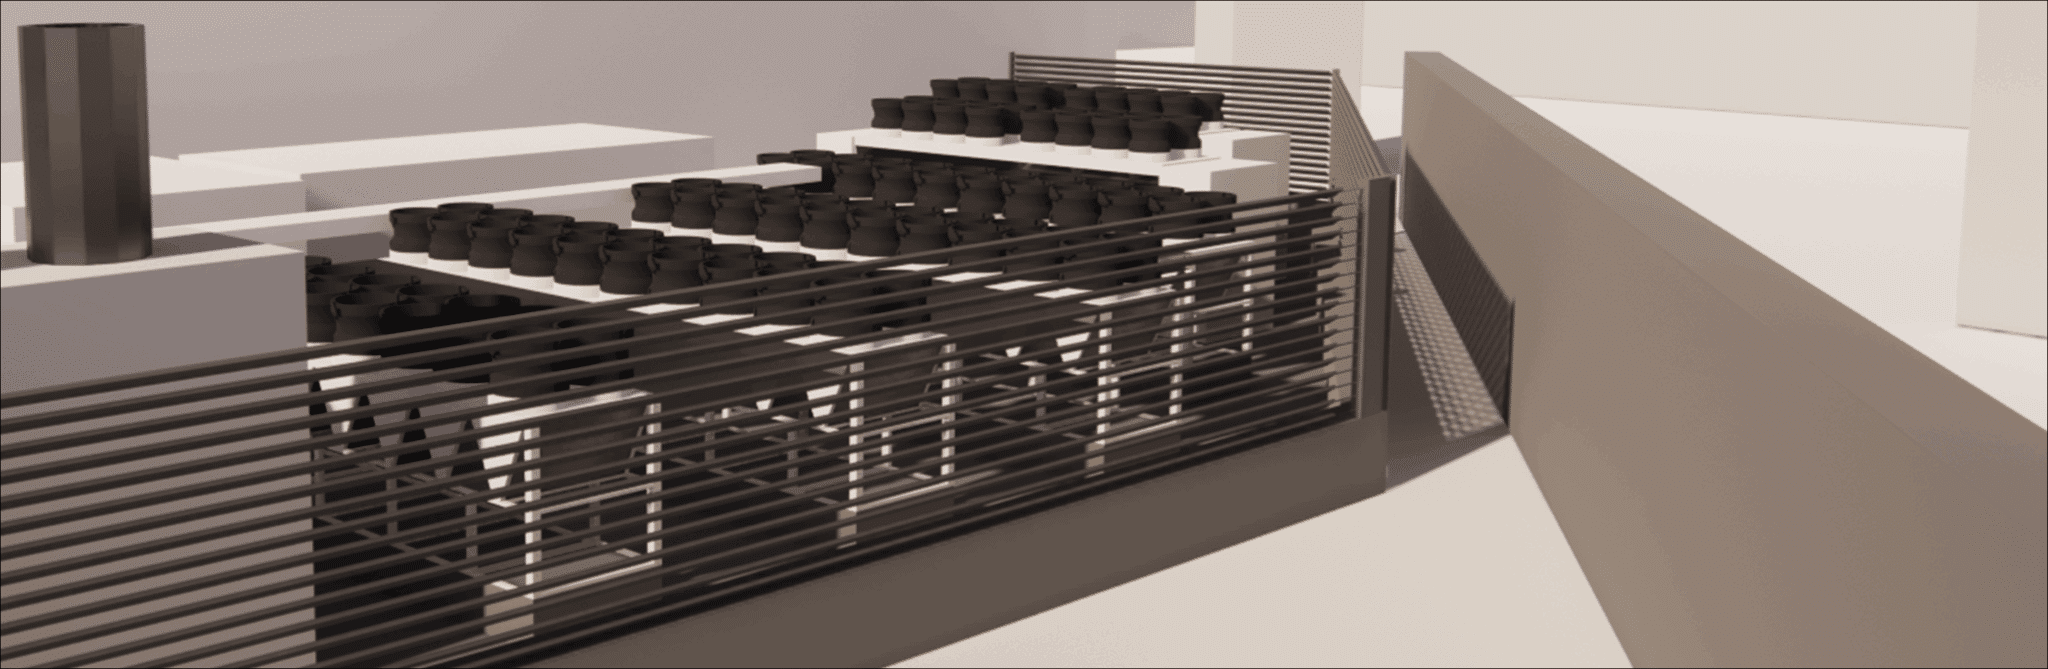
The technical area on the ground of the data center studied by EOLIOS groups together air coolers, generators and transformers in a masked urban environment where thermal recirculation can occur due to enclosure and interaction between discharge and suction. The primary objective is to stabilize exchanger inlet air temperatures andhomogenize suctionvelocity fields, in order to enhance robustness under severe conditions (unfavorable winds, high loads) while limiting plume backflow to the machines. The introduction of screens such as cowlings and filtering elements such as louvers is one of the levers studied to break up loops and guide a more favorable air supply to the exchangers.
In addition to the equipment itself, the morphology of the site and the presence of nearby obstacles (low walls, neighbouring buildings, peripheral racks) play a decisive role. They can create low-velocity zones, lateral recirculations or wake vortices that locally reinject hot air in the vicinity of the air intakes. The study places these effects in a “prevailing winds / overturning winds” reading, in order to qualify the directional sensitivity of the system and ensure that the solutions selected remain effective under a realistic range of meteorological and operating conditions.
EOLIOS is a leader in external CFD simulation for Data Centers. Our studies are based on feedback from measurement campaigns in real-life conditions and from a hundred or so simulated sites around the world.
Start of the EOLIOS process: Site audit for CFD
Thermographic measurements and initial hypotheses for thermal looping
The on-site audit revealed local recirculation around some air coolers, an imbalance in measured temperatures between two equipment rooms, and an underflow air cooler.
These indices confirm theheterogeneous nature of the mixing and the need for targeted treatment of sensitive areas and plume trajectories. Measurement campaigns (anemometry, smoke, thermal imaging) also point to the effect of groundclutter and masks on the dispersion of hot emissions. These elements were used to calibrate the modelling, position the CFD cross-sections and prioritize mitigations likely to bring the greatest benefit with the least impact on operations.
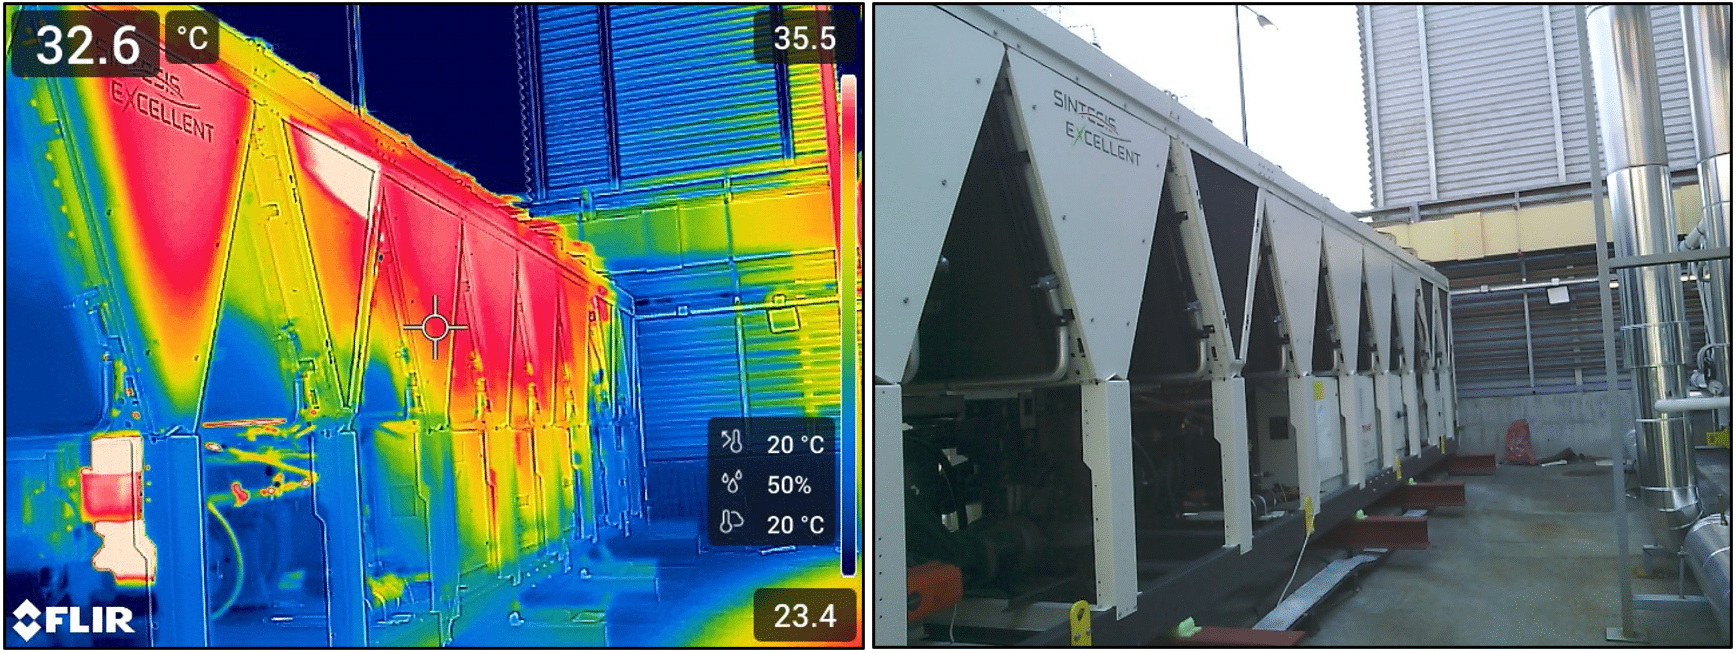
Thermographic readings clearly show areas of hot air recirculation (thermal looping) around some air coolers. IR images show hot halos and thermal tongues developing in the vicinity of light-colored hoods, indicating plume drawdown and partial re-suction by neighboring heat exchangers. In the immediate vicinity of the hoods and air cooler casings, the apparent temperature rises and stretches in the direction of flow, reflecting insufficient dilution of the emissions and recirculation on short trajectories. The phenomenon is amplified when the incident wind collides with side screens or walls, creating low-speed zones and wake vortices that trap hot air at the air intakes.
In addition to machine emissions alone, the morphology of the technical area on the ground contributes to this accumulation: cluttered surroundings, partial cowlings that deflect jets without lifting them out of the suction zone, cable and network routes that reduce free cross-sections and generate aeraulic shadows. Under certain wind conditions, these obstacles create local loops and wall effects that delay heat dissipation, promote plume coalescence and accentuate temperature rises at the foot of the unit. All these findings explain the over-temperature detected by thermography around the air coolers, and justify targeted deflection and filtering actions (continuous hoods, oriented louvers) to break the loops, open up the flows and purify the intake air.
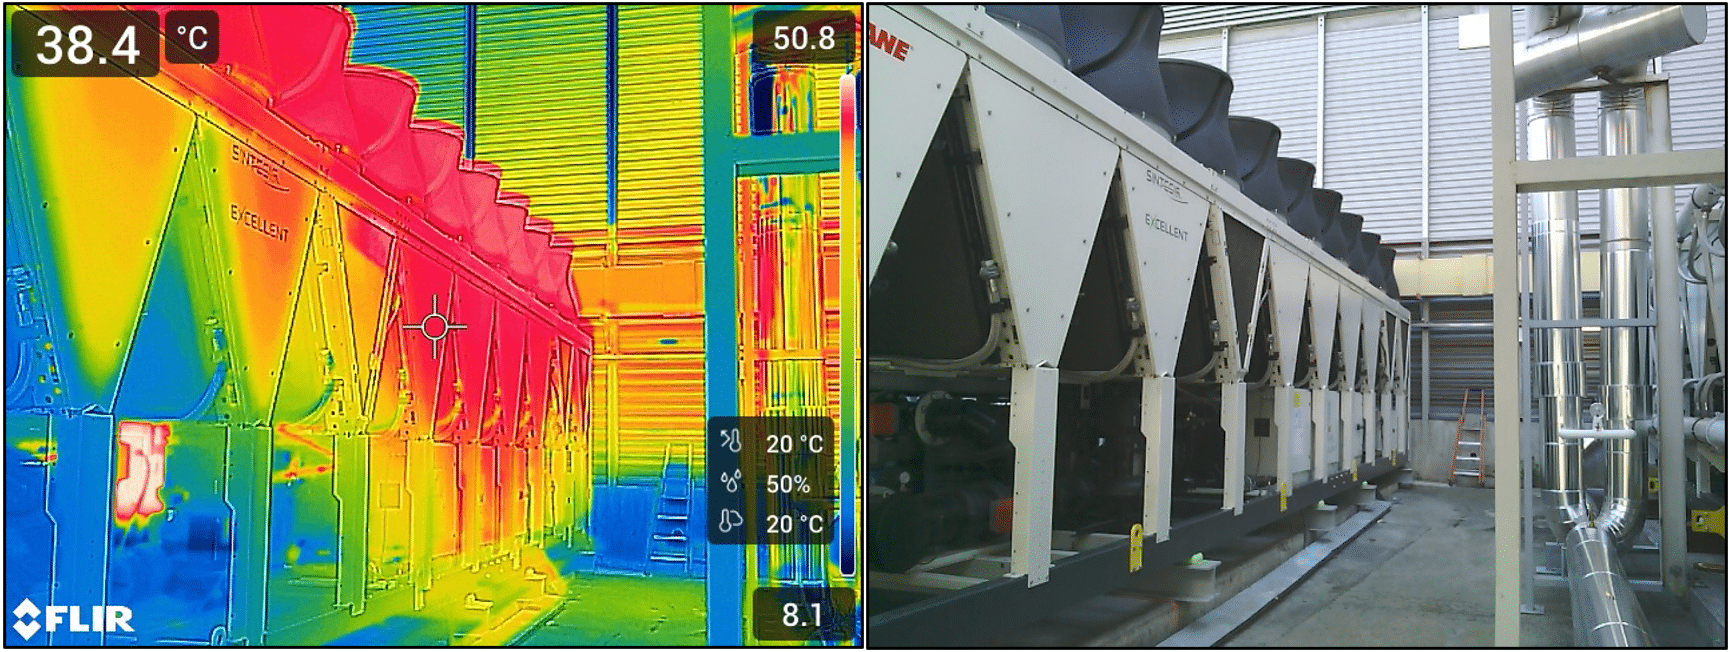
Thermal imaging reveals a pronounced thermal loop directly linked to the enclosed configuration of the air coolers. The presence of a back wall acts as a reflecting wall, limiting dispersion and drawing the hot plume upstream. Under the effect of the incident wind, the jet is partially pressed against the wall (wall effect), the boundary layer thickens, velocities fall and a flow reversal appears at the foot of the machines. This creates a low-velocity zone with wedge-shaped vortices that trap the heated air; isotherms tighten near the wall and the cowlings, indicating insufficient dilution and a backflow of calories to the suction side.
This topology explains the higher apparent temperatures recorded by IR imaging around these units, and the persistence of hot pockets despite nominal ejection rates. It justifies targeted deflection and filtering measures (better-connected continuous hoods, oriented louvers, raising or dephasing of discharge), designed to break the recirculation loop, speed up room settling and decorrelate plumes from wall-mounted air intakes.
The choices made by the EOLIOS teams in dividing up the area to facilitate customer communication
The perimeter covers the technical area on the ground, divided into three functional sectors – left zone, central zone and right zone – to reflect differences in wind exposure, the proximity of walls and the suction logic specific to each unit. The inventory includes 11 chillers, 8 generators and 10 transformers; hoods are already in place on the right-hand side, and the majority of machines are equipped with nozzles. The configuration of vents on the GEs, positioned on the outside, is integrated to deflect plumes and avoid their ingestion by neighbouring air coolers.
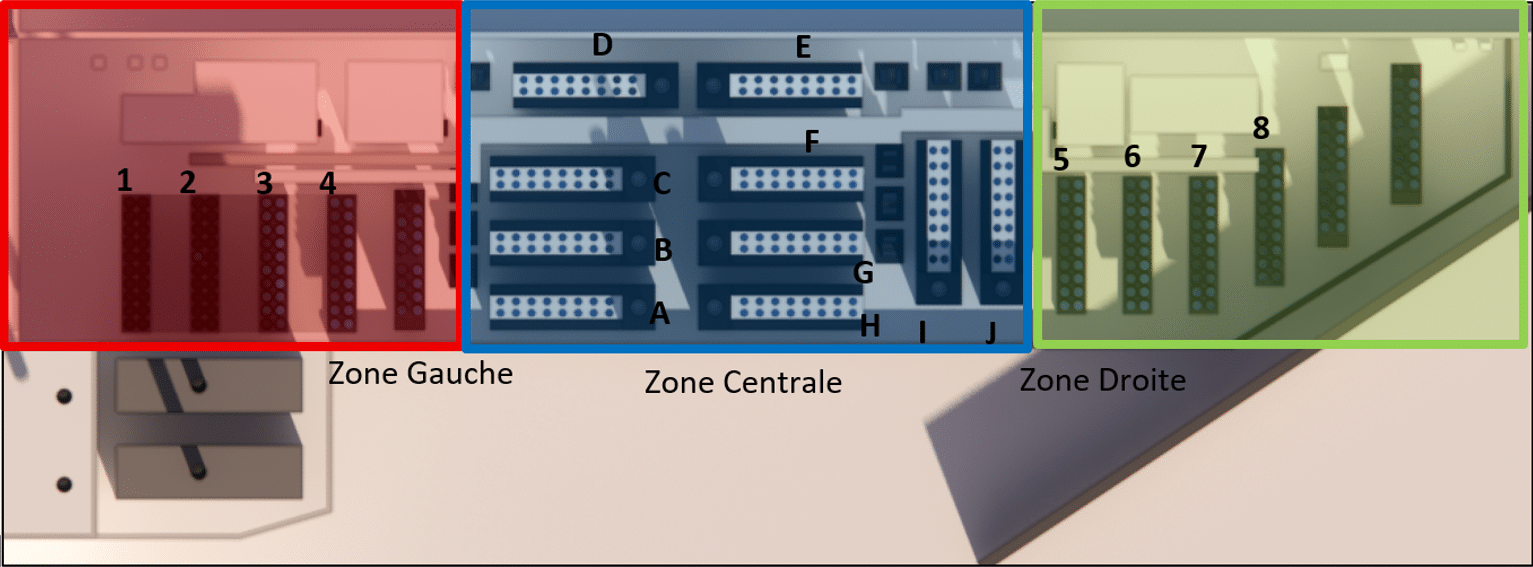
This structuring of the site, coupled with the inclusion of existing accessories, guarantees a faithful representation of actual constraints and enables relevant comparison of scenarios: it makes it possible to pinpoint the most sensitive areas, prioritize interactions (discharge/suction/masking) and target treatments where they are most effective. It also facilitates the phasing of interventions and the definition of control points during operation (inlet air quality, suction homogeneity), so that improvements validated during the study can be deployed and monitored with minimal impact on site activity.
CFD approach & analysis framework for CAD modeling of external data center site
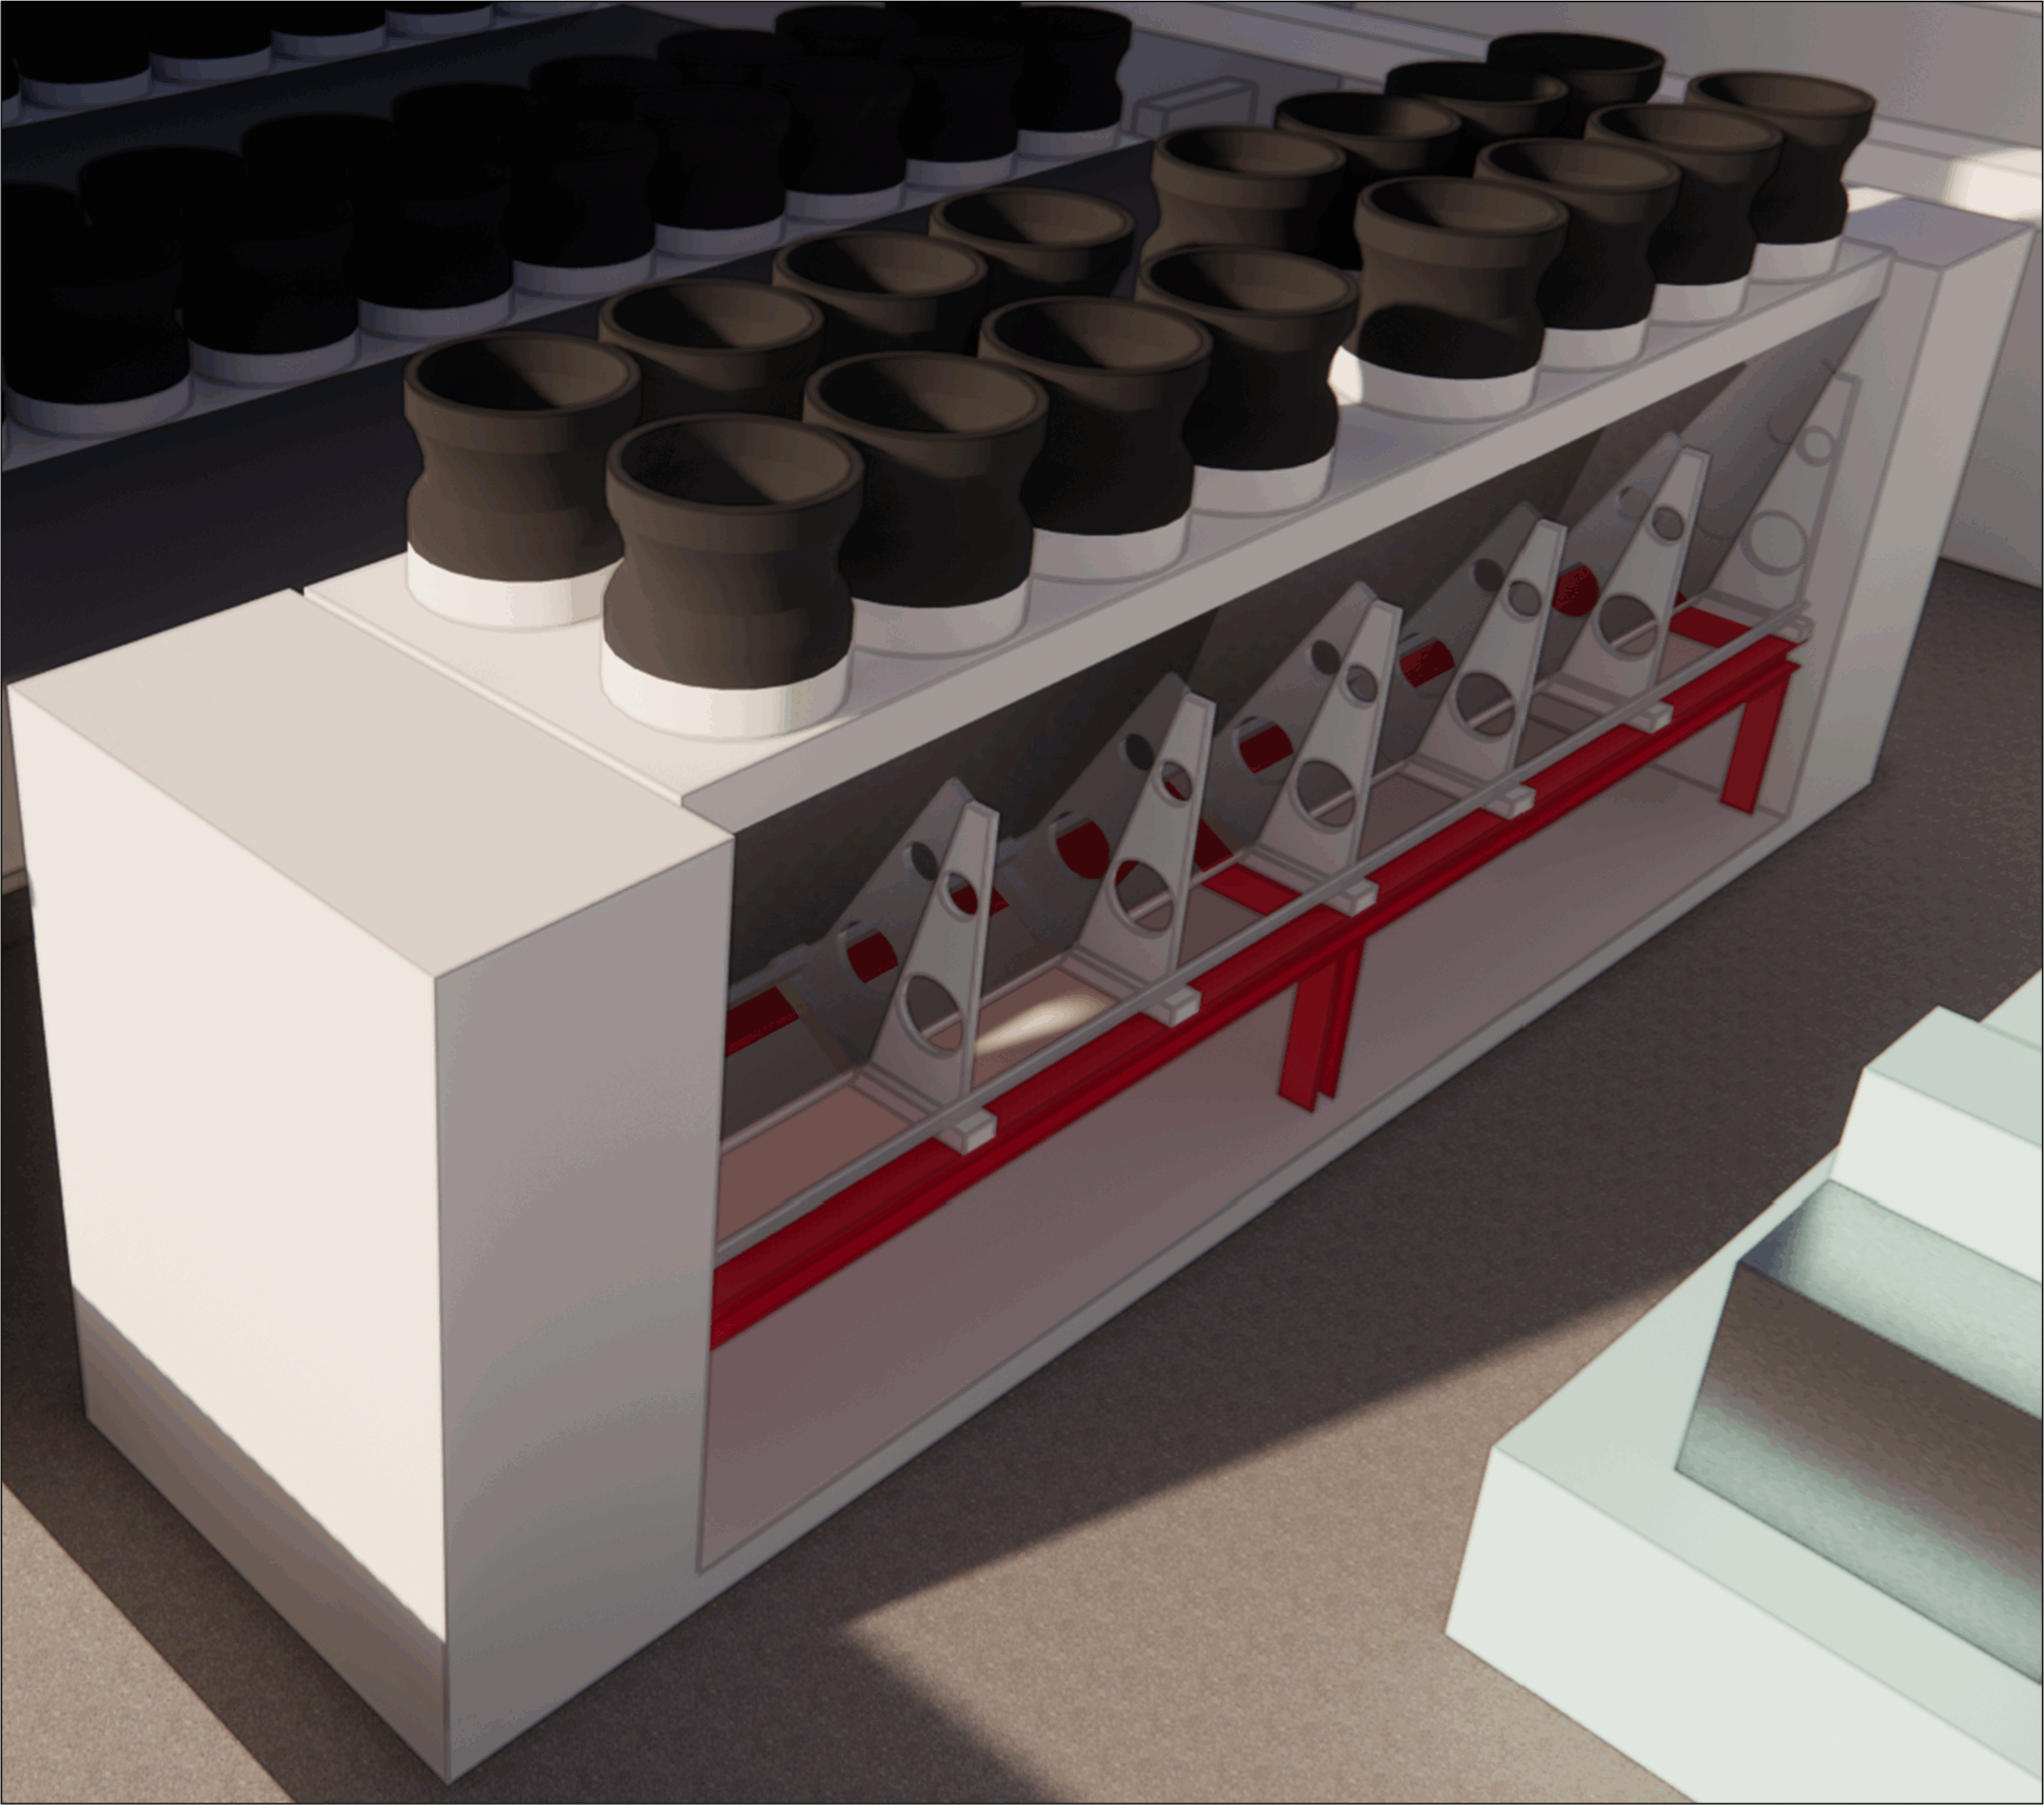
3D modeling adapted to site CFD
The approach is based on an external thermo-aerodynamic CFD built from a detailed 3D model of the technical area, integrating the actual geometry, obstacles and protections (cowlings, ventelles), plenum and return air volumes, as well as peripheral constraints (walls, neighboring buildings, auxiliary equipment). The model is prepared for simulation: CAD cleaning, simplification of non-influential details, and local mesh refinement at air intakes, discharges andenclave zones. The computational domain is extended to capture medium-range reinjections and wake effects; representative wind conditions (incidence, intensity, site roughness) are applied to faithfully reproduce the masked urban environment. This preparation guarantees a consistent physical basis, while remaining compatible with reasonable computing times for iterating on solutions.
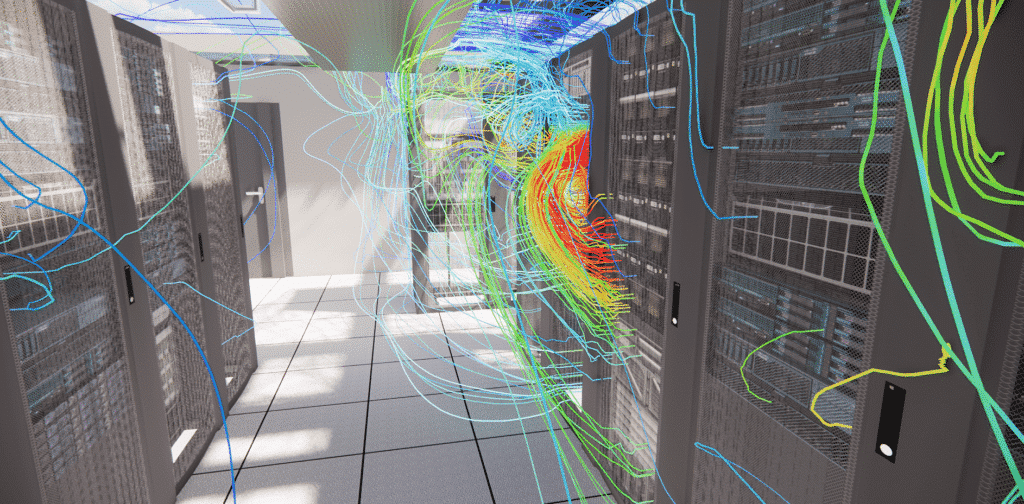
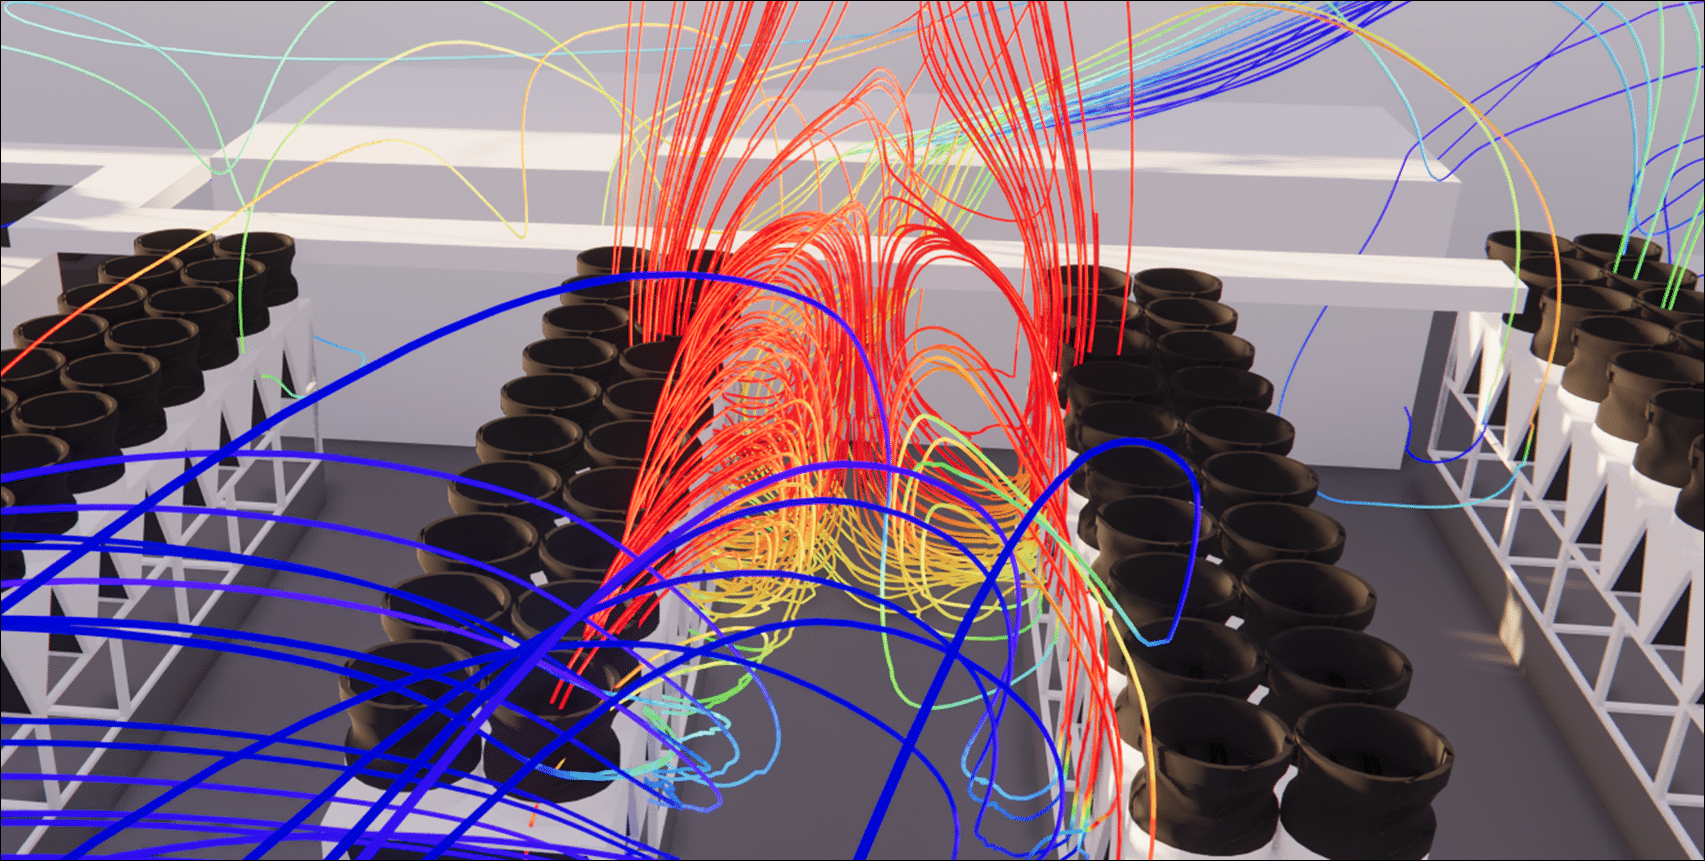
The rendering favors a qualitative reading at the air cooler intake, through velocity planes, temperature planes, current traces/lines and iso-surfaces, enabling us to identify looping mechanisms and qualify inlet air quality without inflation of figures. Cross-sections are positioned at suction level and close to the ground to reveal areas ofstagnant air, while particle seeding is injected from discharges and generators to visualize plume trajectories and returns. Particular attention is paid to gaps between equipment, the edges of cowlings and low-velocity zones, where most recirculation occurs; the analysis then cross-references suction homogeneity, recirculation level (low/medium/high) and flow stability to provide operational guidance on the deflection and filtering options to be implemented.
Use a site audit to model models more accurately
The model developed by EOLIOS is faithfully based on the architecture surveyed during the audit, and incorporates the specific features of theground layout – partial cowlings, nozzles, orientation of the louvers on the outside of the GE, useful heights, center distances, screens and peripheral obstacles. This translation of the real site into a 3D model for CFD is accompanied by CAD preparation and meshing, with refinements at air intakes, discharges and enclosure zones, as well as boundary condition settings consistent with the local context( siteroughness, representative wind incidences,thermal emission levels and operating regimes). The aim is not to produce a theoretical twin, but a physically credible model capable of reproducing theflow and recirculation mechanisms that determine inlet air quality.
The audit ↔ model loop is then used to iteratively compare field thermographic andanemometric findings with CFD maps, to adjust input assumptions (opening conditions, louver selectivity/load losses, discharge coefficients, local roughness, fan curves) and, ultimately, to qualify the model’s confidence level to inform decision-making. Residual deviations are analyzed via sensitivity tests and, if necessary, corrected by targeted adjustments to the mesh or simulated operating parameters until solid convergence is achieved on streamlines,suction homogeneity and recirculation levels. The benefits are twofold: to provide a representation rooted in reality, and to deliver an operational reading grid for teams, where each scenario is legible in terms ofimpact, action priorities and ease of implementation.
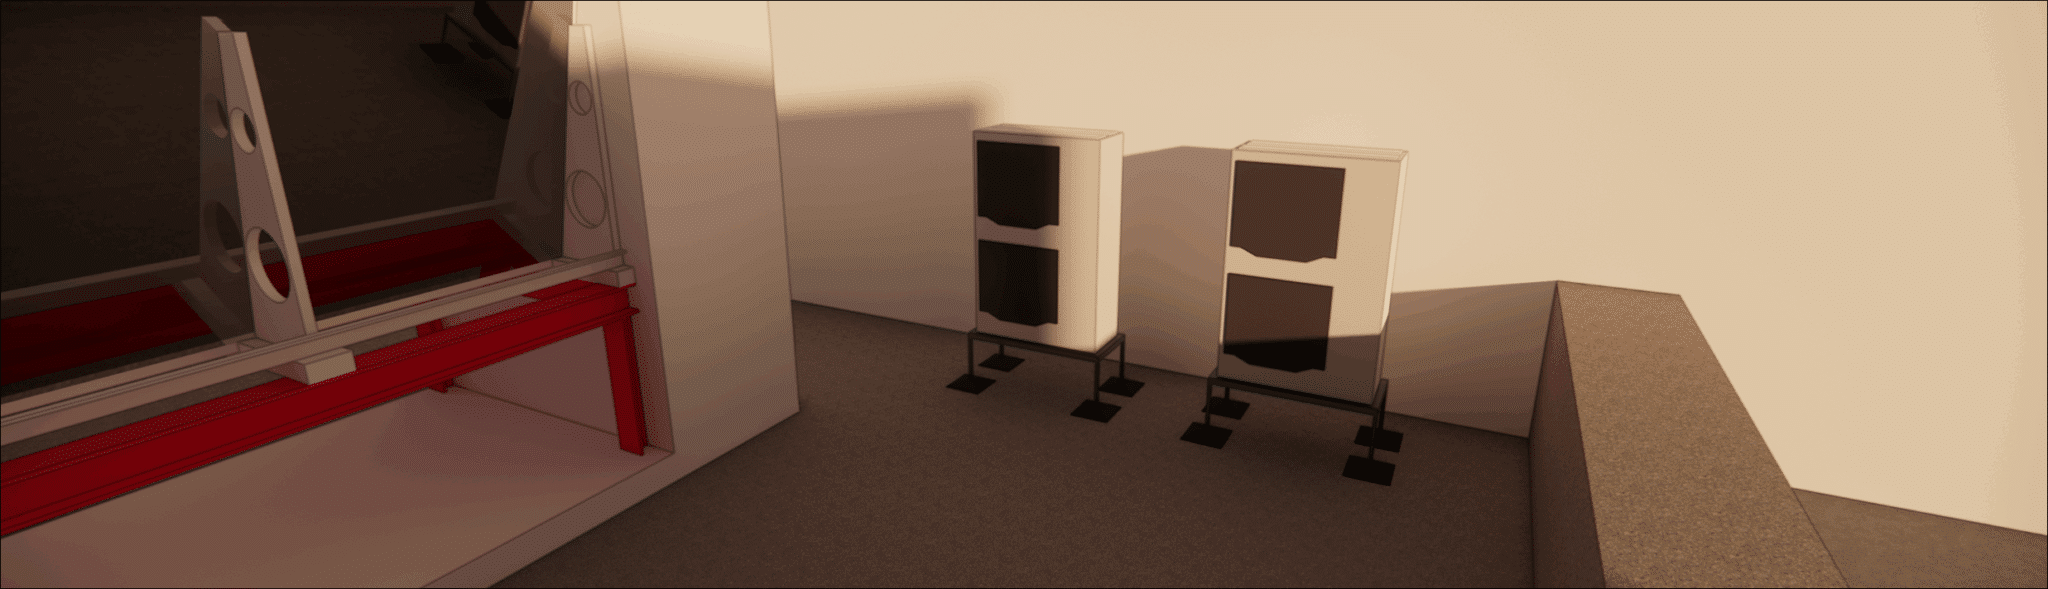
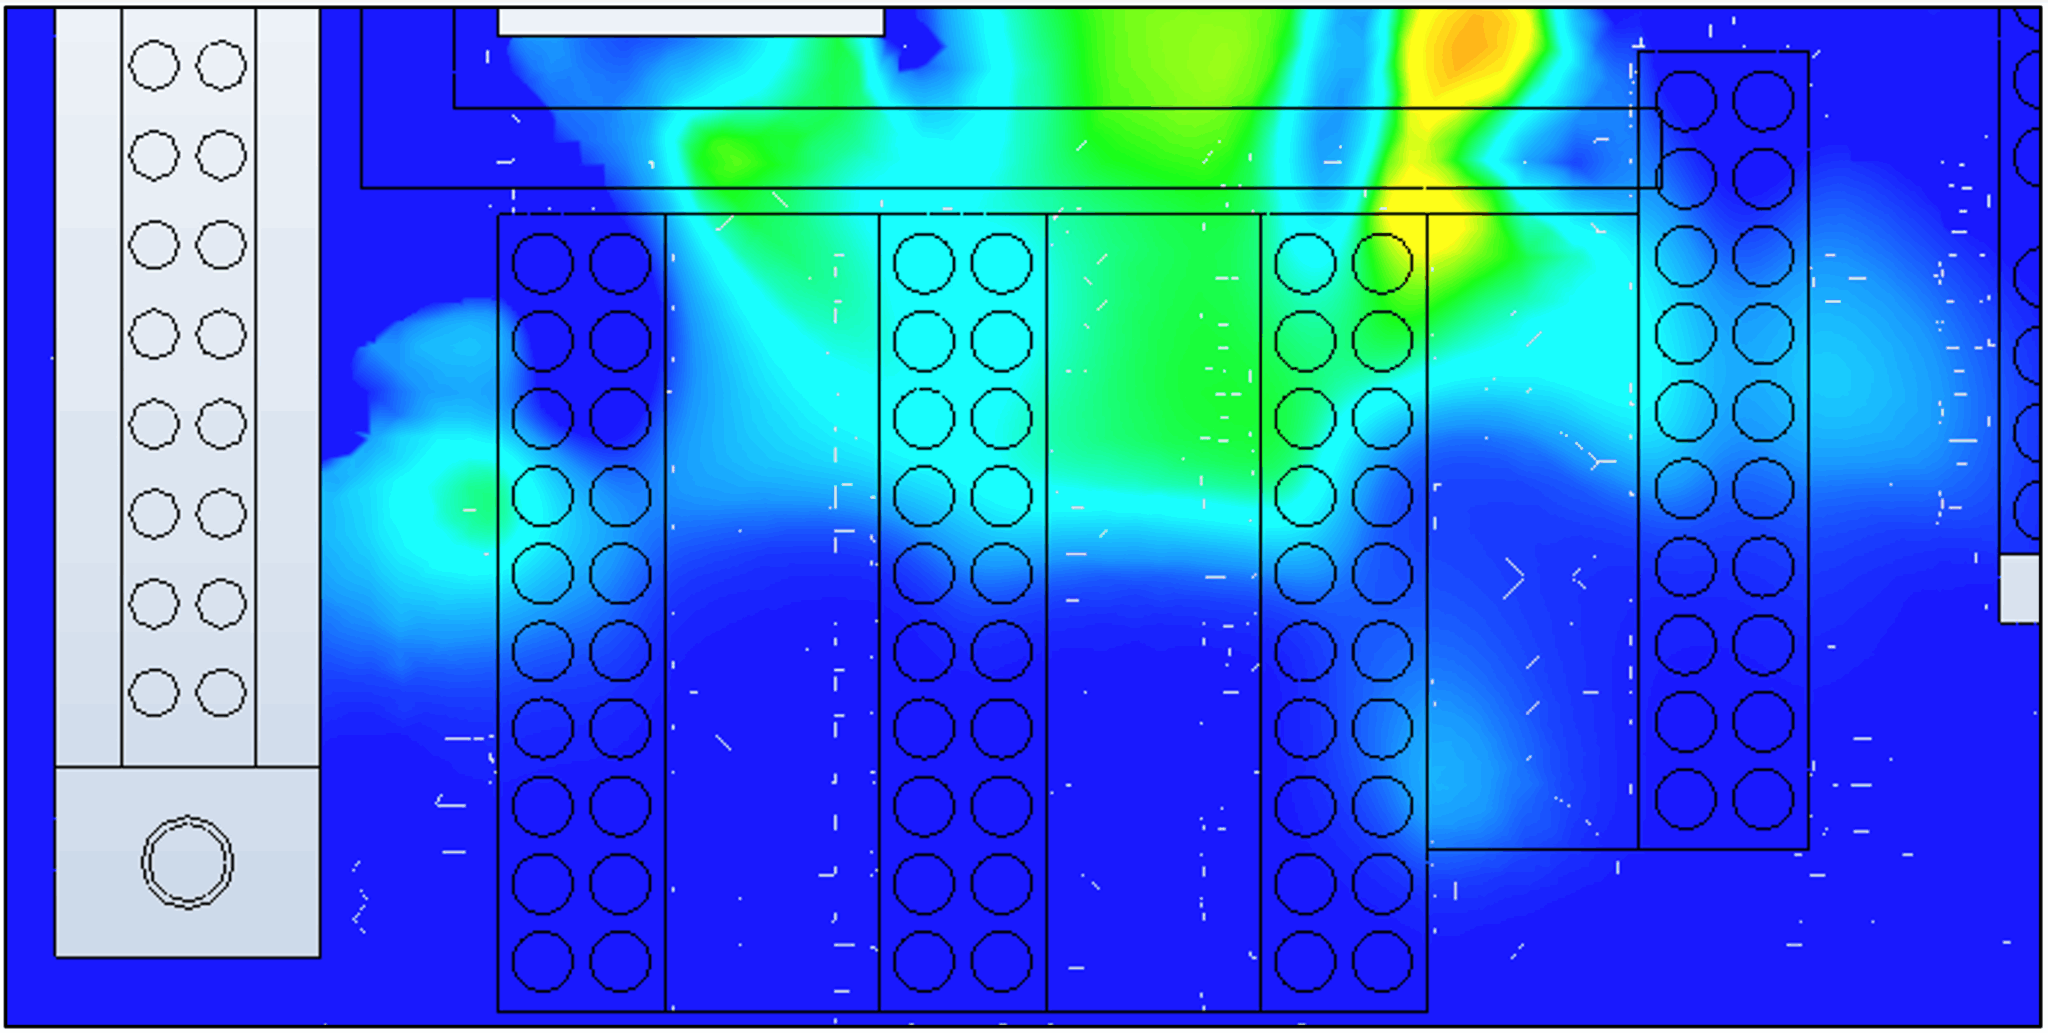
Figure - Temperature and pressure distribution inside a hyperscale data center room
Different scenarios studied to find the best possible solution
Overview of CFD study scenarios
Four representative configurations were studied:
- The benchmark without hood,
- The installation of capotages on the left,
- The combination of hoods and louvers between GE and air coolers,
- And targeted optimization of the right-hand zone by rebalancing rejects.
This step-by-step progression makes it possible to measure theincremental contribution of each lever – first the cowlings, then the louvers, finally the distribution of discharges on the straight zone – by isolating their own effect and verifying their synergies. This provides a stable comparative reading under different wind incidences and load conditions, confirms the sustainability of the gains (no simple displacement of the problem) and provides a clear decision path: first treat the enclosed zones and the most structuring thermal recirculation, then refinesuction homogeneity and, lastly, smooth the remaining gradients through targeted optimization. In this way, the benefits are validated and maintained in operation, with a good effect/complexity ratio and limited impact on current operations.
Visit hoods protect air intakes from direct returns and raise the trajectory of plumes, thus breaking suction shortcuts and reducing hot pockets at the foot of units; louvers act as an aeraulic buffer, filtering lateral interactions between GE and air coolers and guiding a supply of cooler air to exchangers; optimizing the right-hand row by distributing discharge (alternating more and less emissive modules) aims toeven out loads and desynchronize jets to limit local focusing. Together, they form a coherent chain of actions on the technical ground area, improving inlet air quality, reducing sensitivity to overturning winds, boosting cooling resilience and facilitating maintenance thanks to clearer flow fields.
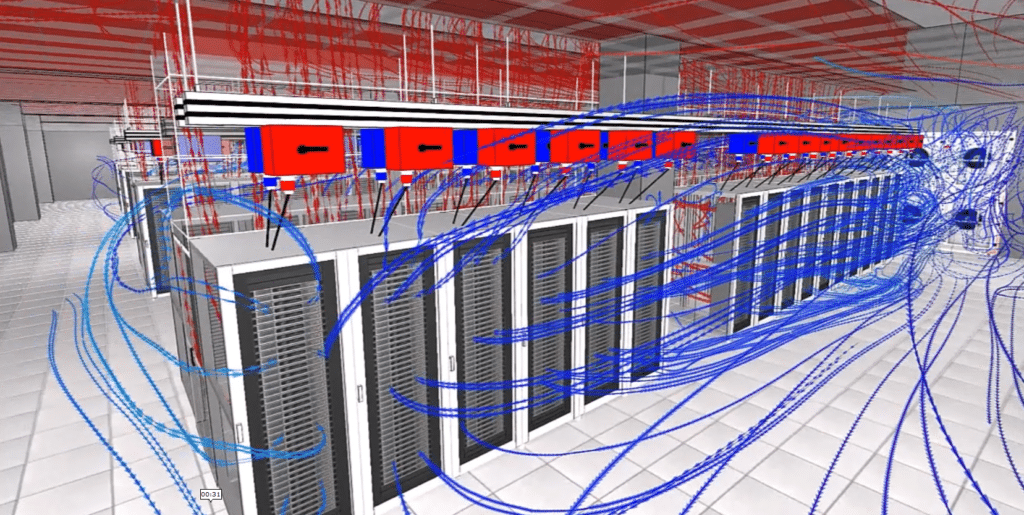
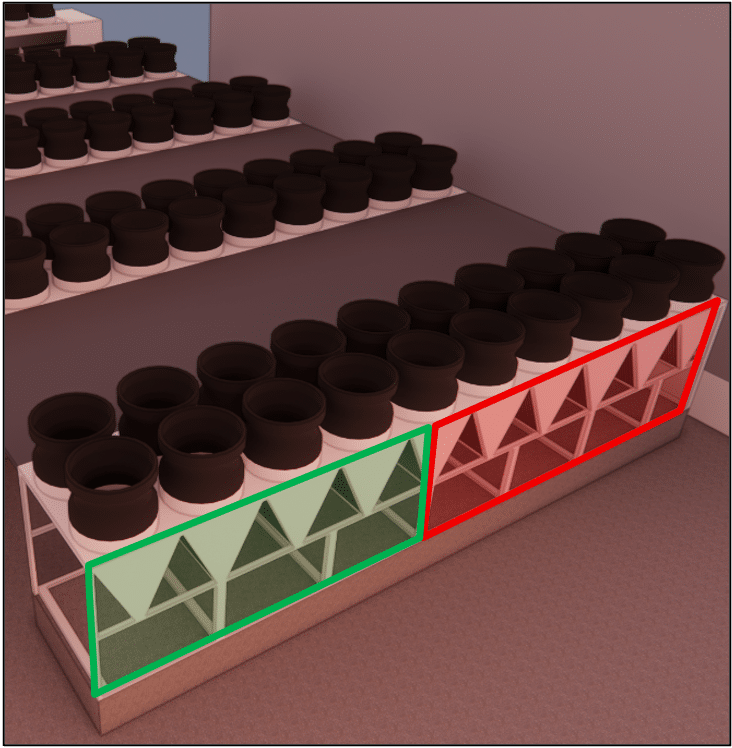
Variant for balancing heat generation in air coolers
Distribution of heat generation in a green chiller, 1/3 of the heat is recovered from the air, and in red 2/3 of the power which results in high heat generation being concentrated close to the wall.
One way of reducing heat recirculation is toalternate the positioning of the chillers tooptimize heat generation.
Such a configuration will therefore be studied later when the hoods are positioned, and only in the right-hand zone.
Results of CFD studies: innovations and sustainable solutions for optimizing data center cooling
Left zone - Study of air cooler suction temperatures
In the reference configuration, loops at the foot of the units are clearly visible: thehot expelledair is drawn back by nearby obstacles, remains in contact with the suctions and degrades the inlet air quality of the air coolers. The flow lines show suction shortcuts and low-speed zones that stabilize hot pockets at grille level, especially under certain wind conditions and near walls. The addition of hoods reduces this enclosure and raises the plume trajectory, limiting immediate recirculation; nevertheless, aeraulic shadows persist at the edges of equipment, where the flow remains insufficiently energized and retains residual heterogeneity.
With acombination of hoods and louvers, the area is clearlycleaner: hoods provide the main deflection of discharge, while louvers act as an aeraulic buffer, filtering lateral interactions and channelling cooler air to the air intakes. Temperature maps and current traces show a significant reduction in recirculation, decorrelation of discharge/intake and homogenization of approach velocities in the vicinity of the exchangers. The qualitative reading thus shifts from a high level of thermal recirculation to a low level over most of the sector, with sensitivity still perceptible on the free edges – compatible withoperation and controllable by careful piloting during the most unfavorable wind regimes.
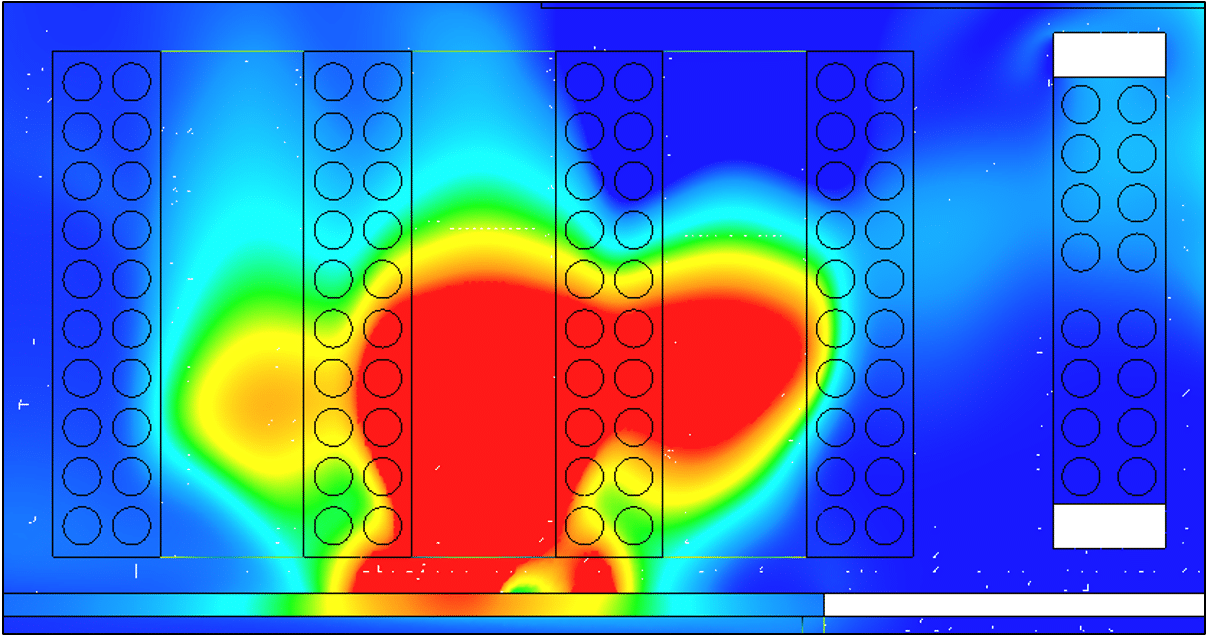
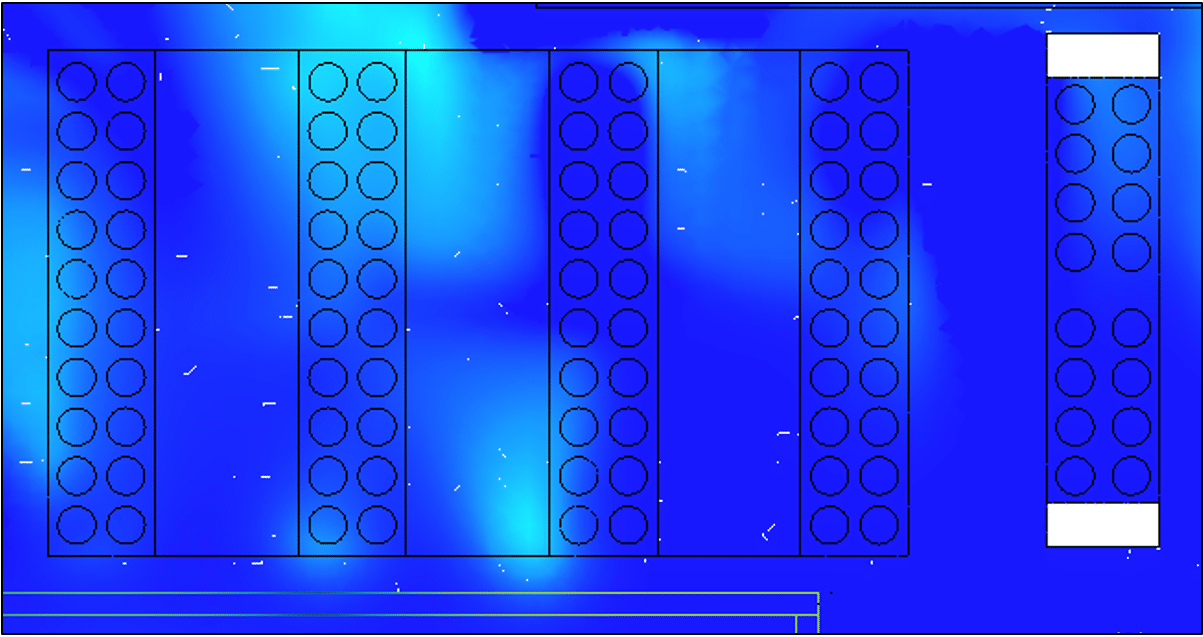
Comparison of temperature plans before and after EOLIOS optimization
Central zone - Study of heat dissipation from generators
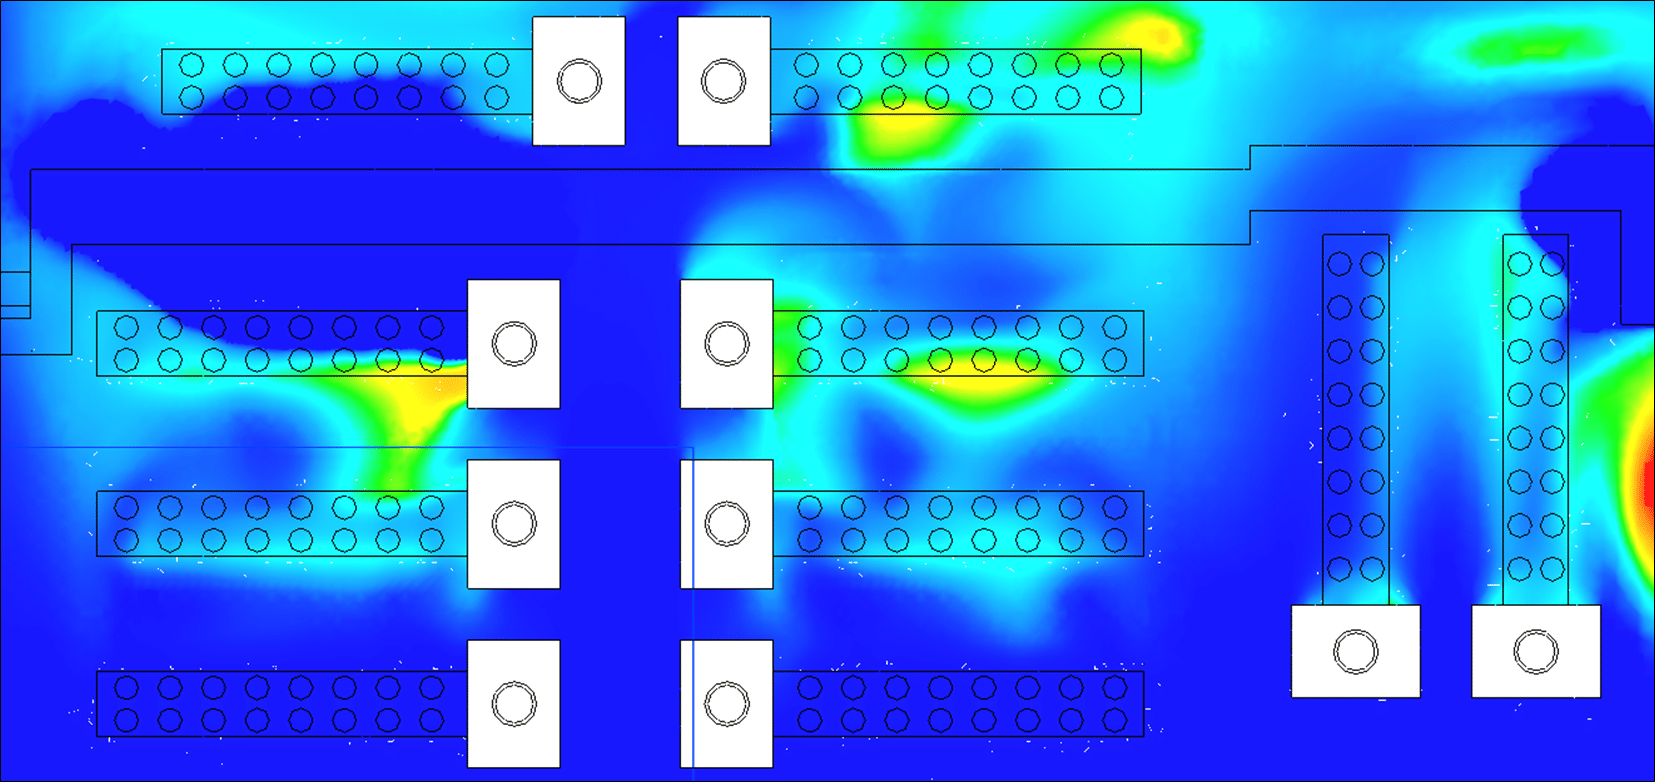
The central zone is less susceptible to thermal recirculation. The mixing induced around the generators creates a more energetic exchange volume, effectively decoupling the main discharges from neighboring aspirations and promoting rapid dilution of the plumes. Under prevailing winds, the streamlines follow the local morphology – flow corridors, lateral clearances, stalls – which limits the formation of persistent low-velocity zones. As a result, air velocity planes show stable, legible trajectories, with controlled gradients at air intakes.
Under these conditions, recirculation remains moderate, confirming that action priorities must focus on the extremities of the technical area, whereenclosure and wall effects generate more pronounced returns. A lighter treatment is therefore appropriate in the center: maintaining homogeneous mixing, keeping a watchful eye on free edges and spot-checking during overturning winds or transient machine regimes. This minimalist calibration guarantees the aeraulic coherence of the sector, while preserving operating flexibility and ease of maintenance.
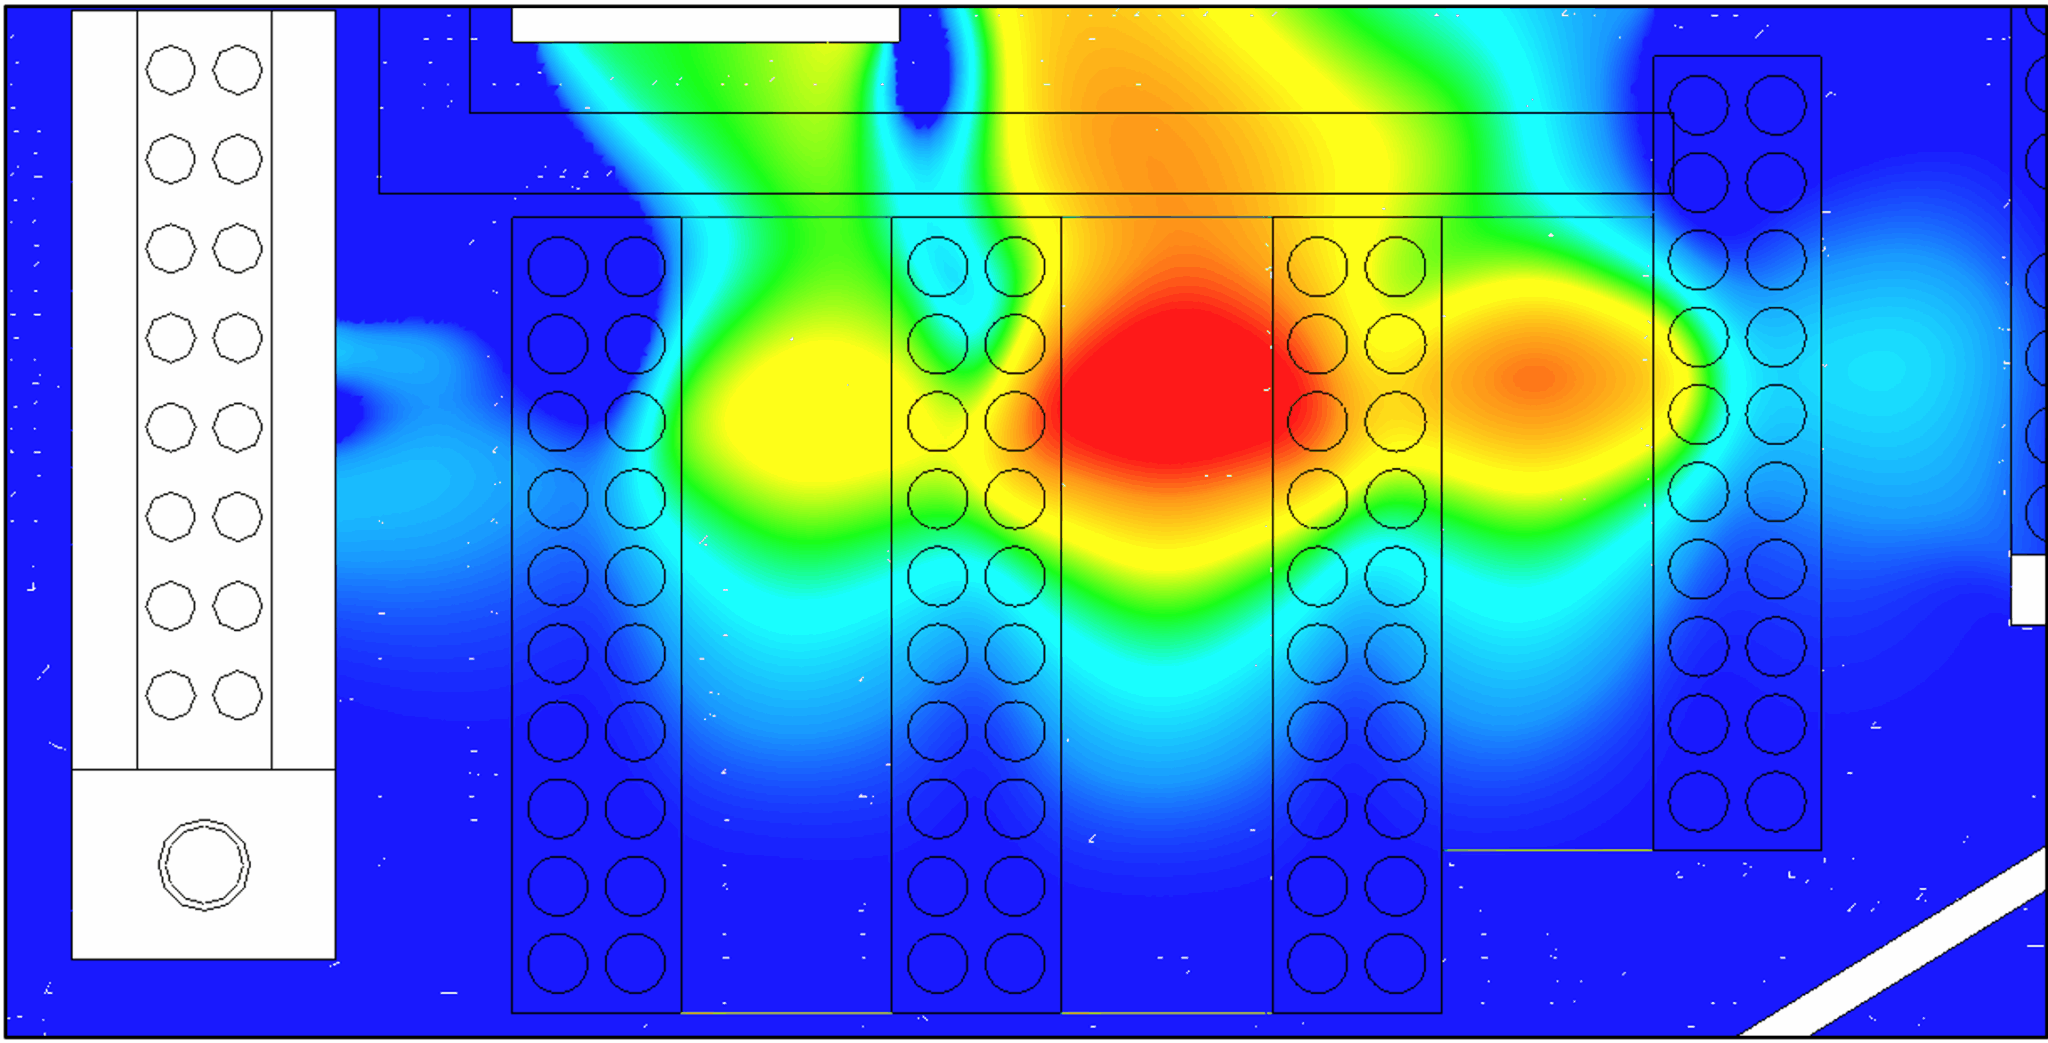
Right zone - Study of suction heat distribution in air coolers
In the initial configuration, the right-hand zone presents a heterogeneous suction pattern, with more pronounced thermal returns, particularly in the vicinity of hard points (walls, screens and section changes). The hoods provide an initial benefit by lowering the loop and raising the trajectory of the plumes, thus reducing suction shortcuts to the air intakes. Optimization by rebalancing discharges – based on thealternation of more and less emissive modules and the desynchronization of jets – evens out the load and stabilizes suction fields; sensitivity to variations inwind incidence is reduced, and streamlines become clearer, with gradients better distributed along the line.
Depending on the sector, there has been a significant reduction in thermal recirculation zones, with residual bangs at the edges that require vigilance during extreme wind events. These residues can be dealt with by careful control (opening states, start-up sequences) and, if necessary, by slight operating adjustments to avoid any localized recirculation. All in all, the result is a robust, long-lasting improvement, achieved without burdening current operations: the system becomes more resilient, inlet air quality stabilizes and maintenance is facilitated by more homogeneous, predictable flow fields.
EOLIOS ingénierie's expertise in solving thermo-aerodynamic problems in data centers
Recommendations tailored to each project
Thanks to its expertise in numerical simulation, and more specifically in external simulation of data centers, EOLIOS was able to propose various solutions adapted to the project to mitigate looping phenomena. Easily conceivable and inexpensive solutions, such as relocating the systems or installing hoods, were considered. More costly solutions were also discussed, such as the creation ofoutlets to evacuate the plumes to higher ground. After consultation with our customer, certain solutions were selected for a new CFD study. The solutions selected were rigorously simulated. They enabled us to significantly reduce the suction temperatures of the systems, thus improving their efficiency. In view of the results and the cost involved, we decided to redesign the systems and install shrouds on the chillers.
Detailed analysis of available cooling capacity has also enabled the benefits of each solution to be quantified precisely, providing a clear assessment of the impact on cooling system performance.
Thanks to this study, EOLIOS has been able tooptimize the design of rooftop systems. This optimization will reduce the risk of system breakdowns and power loss due to high temperatures. What’s more, the design will reduce the annual energy costs of running the cooling systems. A more detailed study would also enable us to quantify thesavings associated with this optimized design.
Find out more:
Video summary of the study
Summary of the study
The study carried out by EOLIOS ingénierie focuses on thethermal optimization of hyperscale data centers, using CFD (Computational Fluid Dynamics) simulations. This approach improves air circulation andcooling system efficiency, thereby reducing energy consumption andcarbon footprint. Hyperscale datacenters, used by technology giants such as Amazon and Google, require modular, automated and sustainable solutions. EOLIOS has identified problems such as overheating and looping, and proposed solutions such as the installation of hoods to mitigate these phenomena. The integration of digital twins for accurate simulations has enabled significant improvements to be envisaged. Working closely with customers, EOLIOS has optimized the configuration of cooling systems, increasing efficiency while reducing energy costs. This study demonstrates the crucial impact of CFD simulations on the performance and sustainability of modern datacenters.
Video summary of the mission
Discover other data center projects
Simulation and optimization of thermal plumes – Data Center
Engineering smoke extraction in a data center
External & internal CFD – Data Center Hyperscale
CFD Optimization – Data Center
Data Center – DC28 – Internal
Pressure loss study – Generator – Data center
Data Center – PA 22 – External
Technical premises – Data Center
Cooling optimization – Data Center
Data Centers – DC15.1 & DC15.2 – External
Data Center – Paris
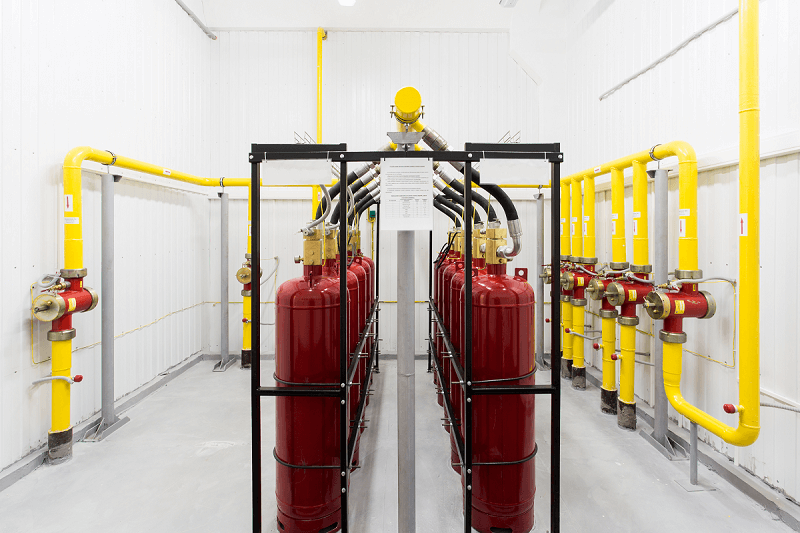
Data Center – GAZ NOVEC
Data center – DC25 – Internal
Data center – DC17 – Internal
Data Center – DC10 – Internal
Data center – DC25 & DC26 – External
Data center – D14 – External
Data center – DC17 – External
DC23 – External